Vectors and Derivatives: MATH 151 K.1 Problems 1-8
Derivatives and vectors with some physics applications
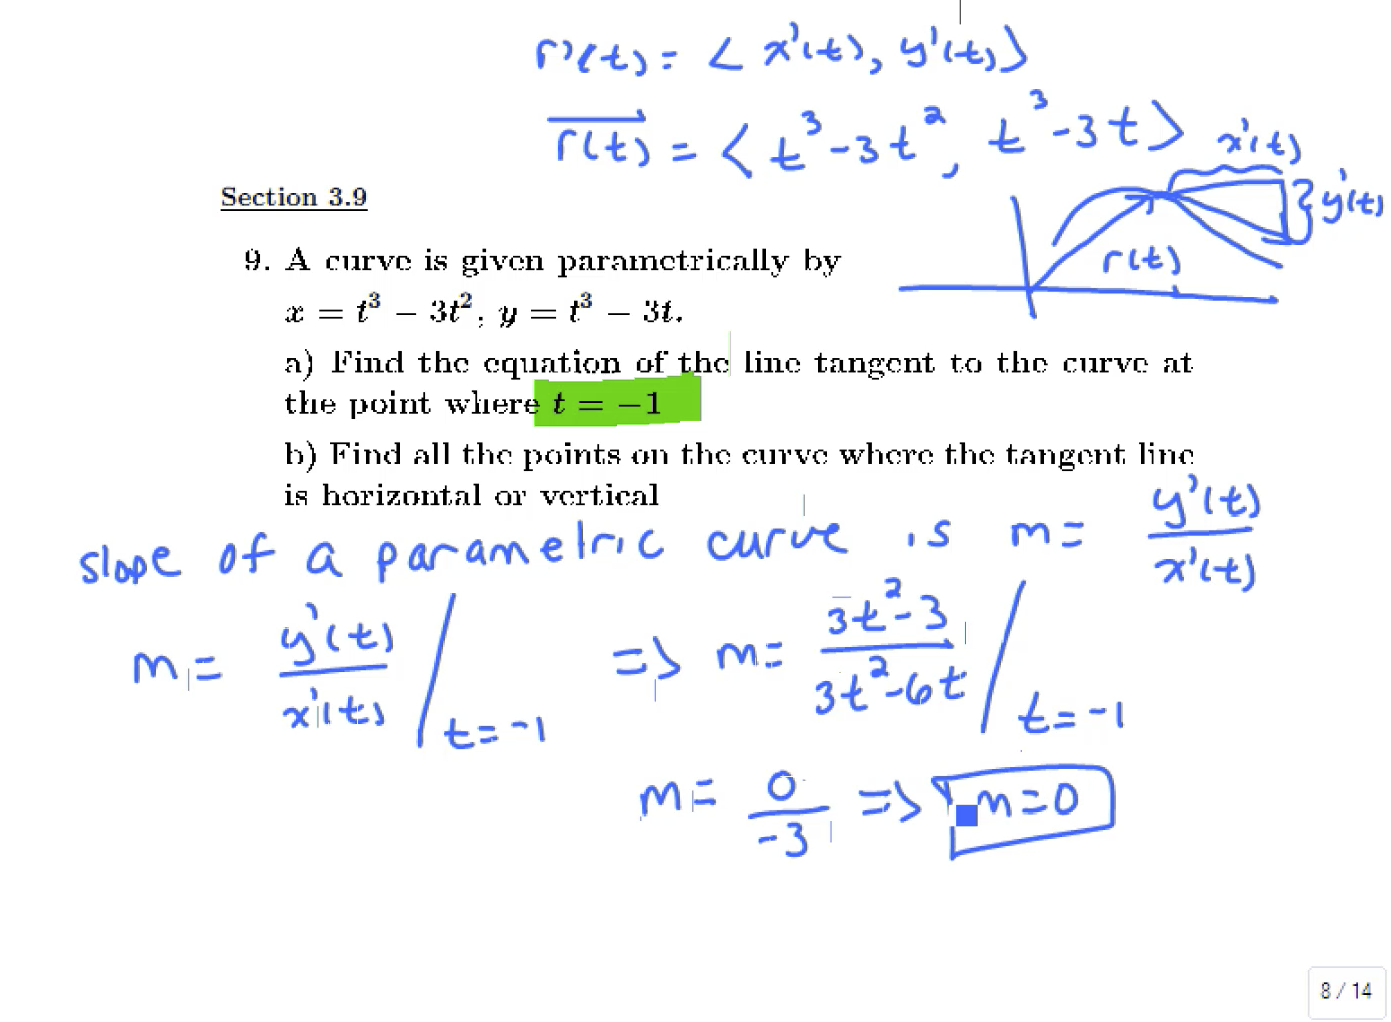
Problem: Plot the parametrized curve \(x=t^3-3t^2,\) \(y=t^3-3t\) on \(t=[-2,3]\) and the tangent line at \(t=-2.\)
Derivatives and vectors with some physics applications

Derivatives and vectors with some physics applications

Derivatives and vectors with some physics applications
Derivatives and vectors with some physics applications
Derivatives and vectors with some physics applications

Using Python to find the equation of the tangent line to a curve and graphing the result

Using Python to plot a parametrized curve and its tangent line at a point
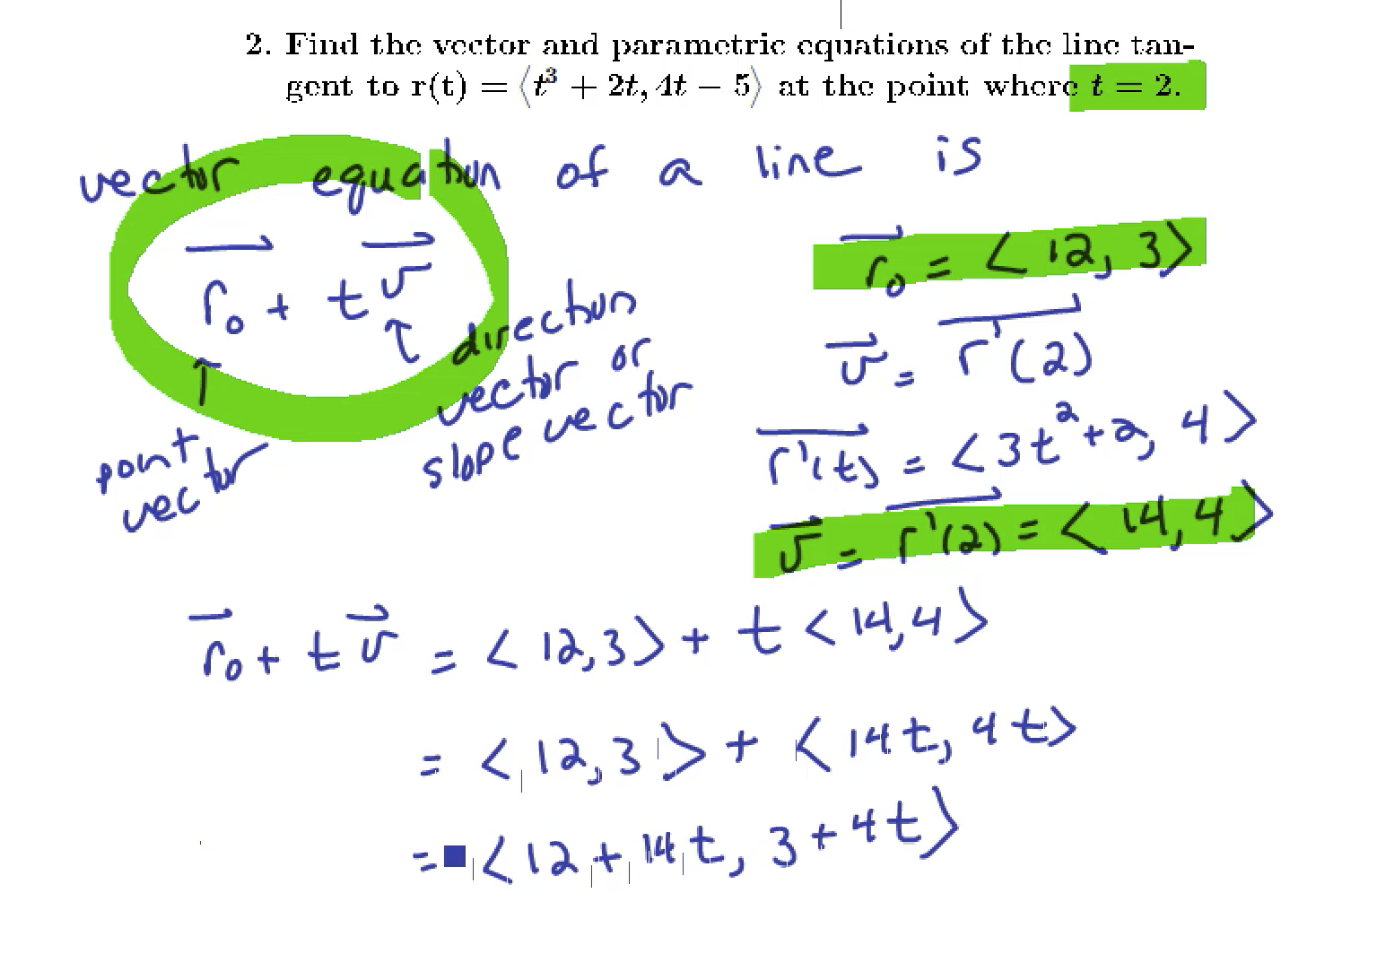
Tangent lines to parametric equations and related rates examples
Review of the limit definition of a derivative and calculating the derivative
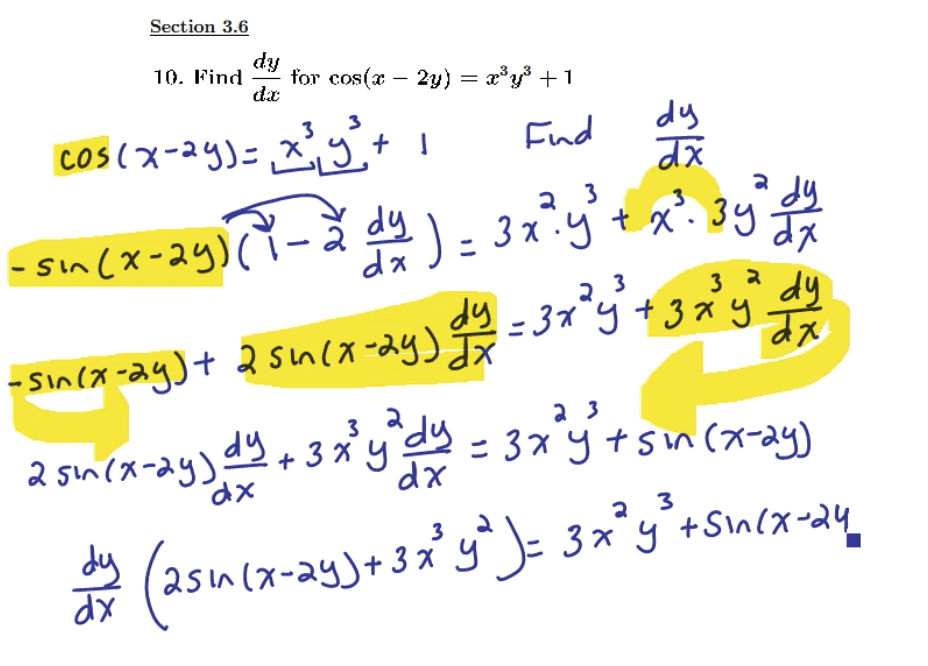
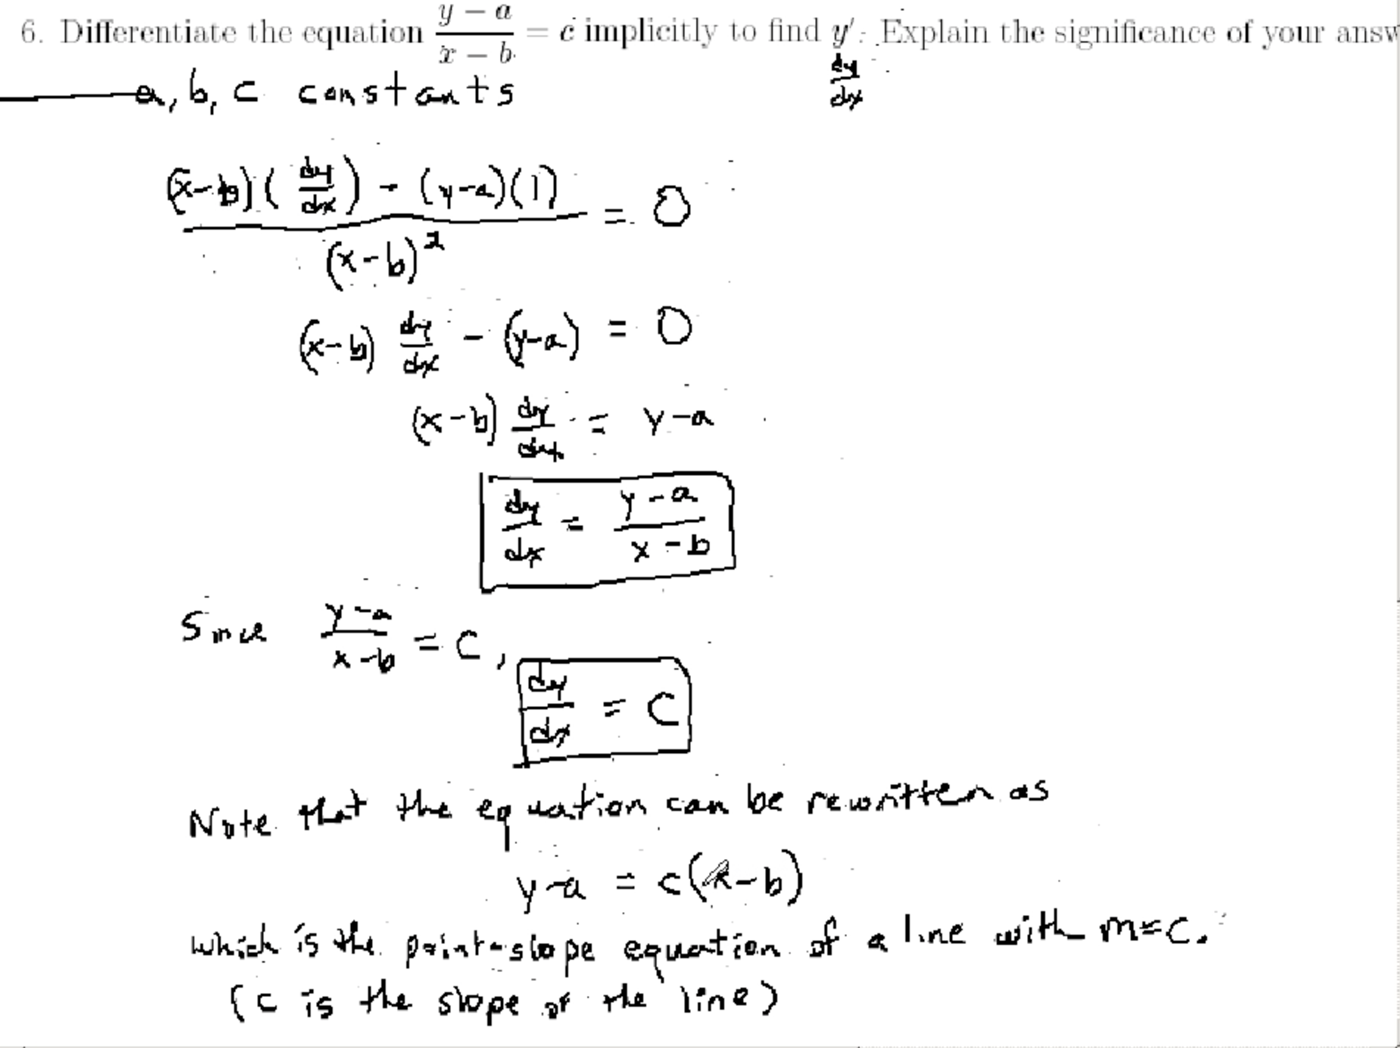
Implicit differentiation and physics applications of derivatives
Derivatives of parametric equations and tangent lines

Review of the limit definition of a derivative and calculating the derivative

Review of derivatives and tangent lines to functions and vector equations
Approximation and Newton's Method, and limits and derivatives of exponential functions
Review of the limit definition of a derivative and calculating the derivative

Review of derivatives and tangent lines to functions and vector equations
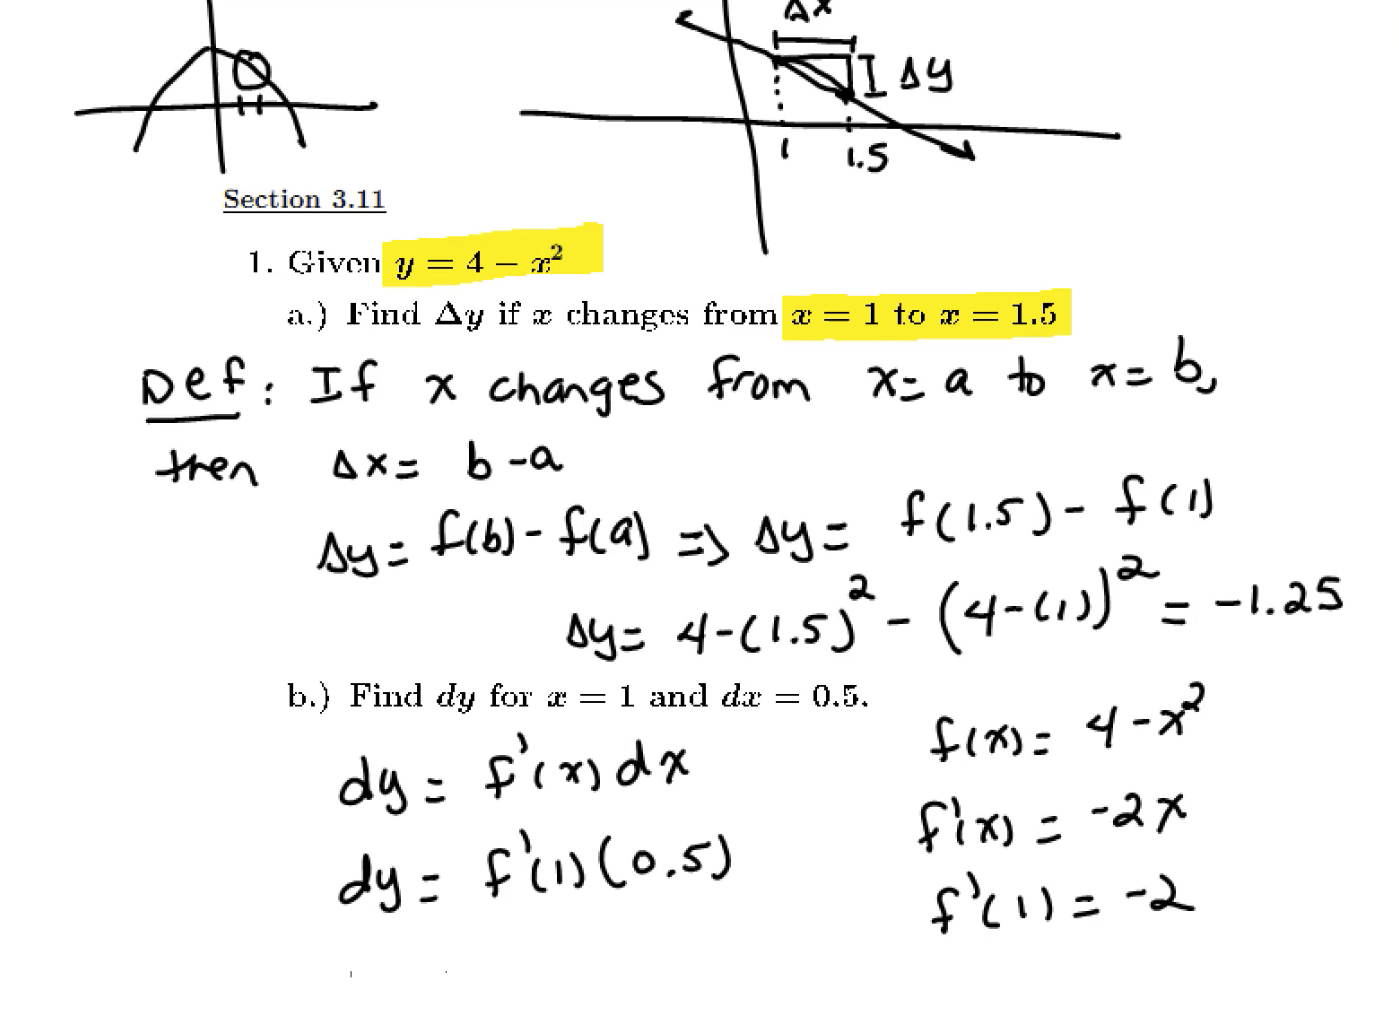
Differentials, linear approximations and quadratic approximations

Review of the limit definition of a derivative and calculating the derivative
Derivatives and tangents to curves
Approximation and Newton's Method, and limits and derivatives of exponential functions

Tangent lines to parametric equations and related rates examples

Finding the points on a parametric curve where the tangent line is horizontal or vertical
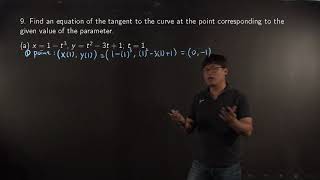
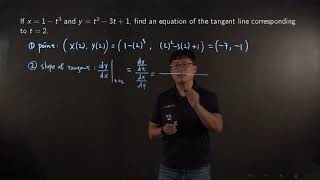
Finding the tangent line to a parametric curve
Finding the tangent line to a parametric curve

Finding where the tangent line is horizontal or vertical for a parametric equation
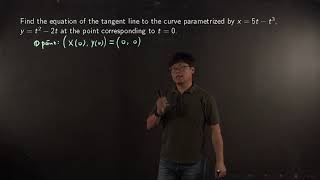
Finding the equation of a tangent line to a parametric curve
Finding the tangent line to a parametric curve

Finding when the tangent line to a parametric curve is vertical or horizontal
Tangent lines to parametric equations and related rates examples
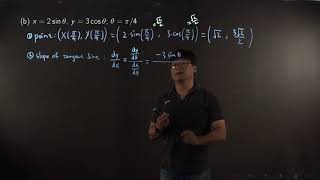
Calculating slopes of tangent lines to parametric curves
Review of the limit definition of a derivative and calculating the derivative
Review of derivatives and tangent lines to functions and vector equations
Implicit differentiation and physics applications of derivatives
Derivatives of parametric equations and tangent lines
Approximation and Newton's Method, and limits and derivatives of exponential functions
Using the limit definition to find derivatives of functions and vector functions
Review of the limit definition of a derivative and calculating the derivative
Review of derivatives and tangent lines to functions and vector equations
Differentials, linear approximations and quadratic approximations
Review of the limit definition of a derivative and calculating the derivative
Derivatives and tangents to curves
Approximation and Newton's Method, and limits and derivatives of exponential functions
Tangent lines to parametric equations and related rates examples

Finding when the tangent line to a function is horizontal in Python

Using Python to plot an implicit curve and find a tangent line using implicit differentiation
Review of the limit definition of a derivative and calculating the derivative

Determining where the derivative of a function does not exist from a graph
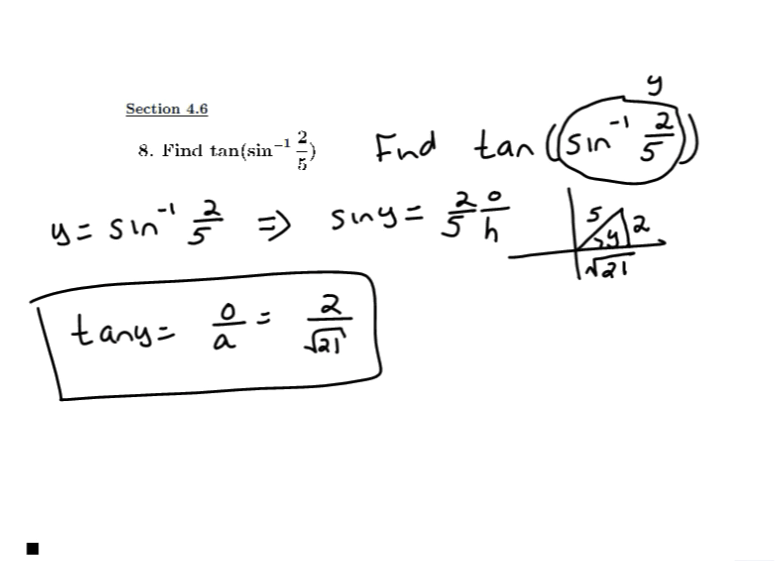
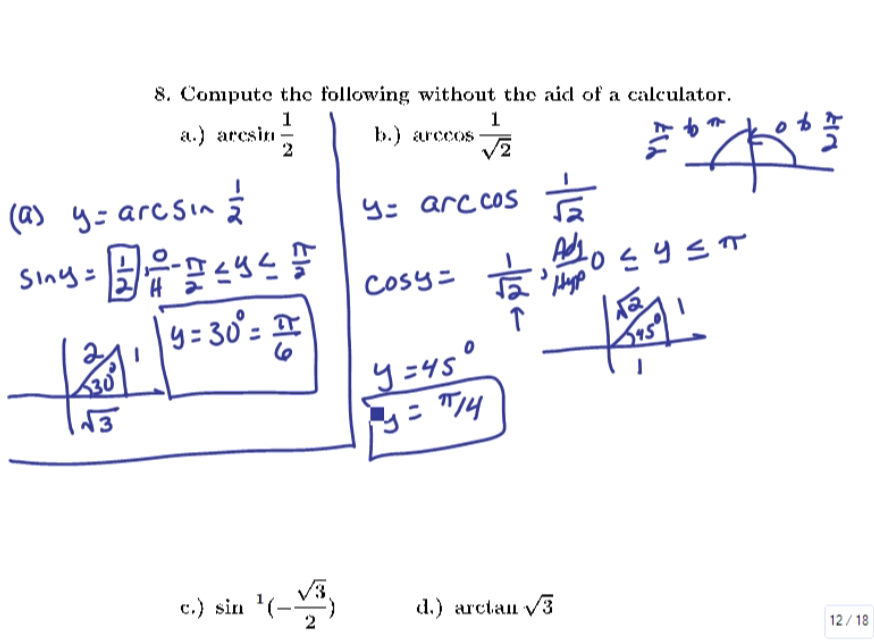
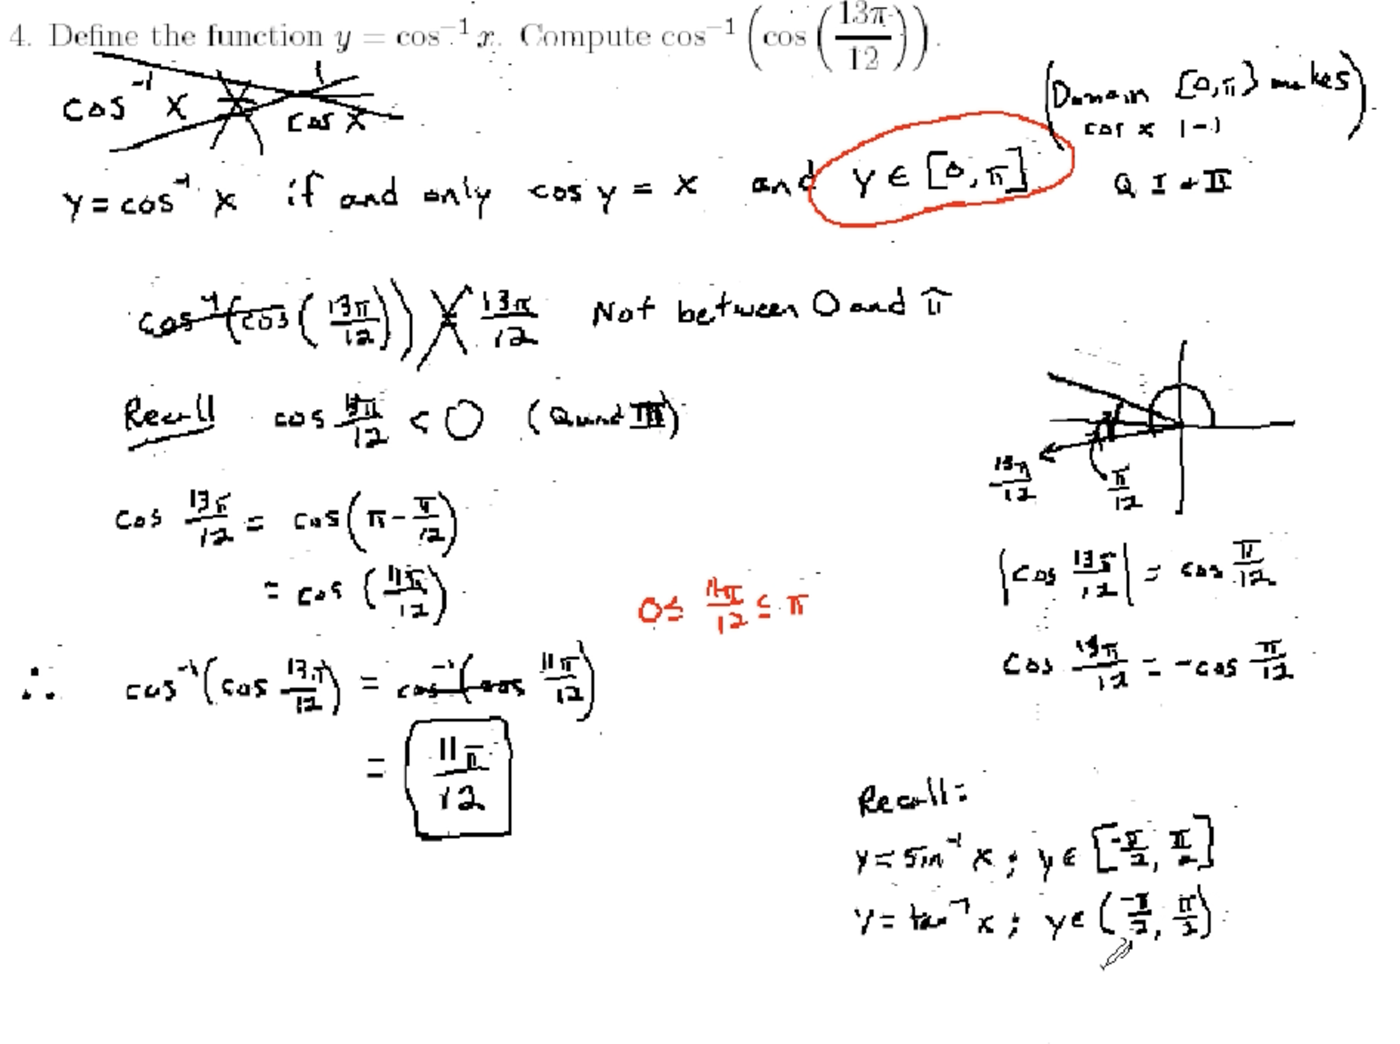
Review of limits and derivatives of inverse trigonometric functions
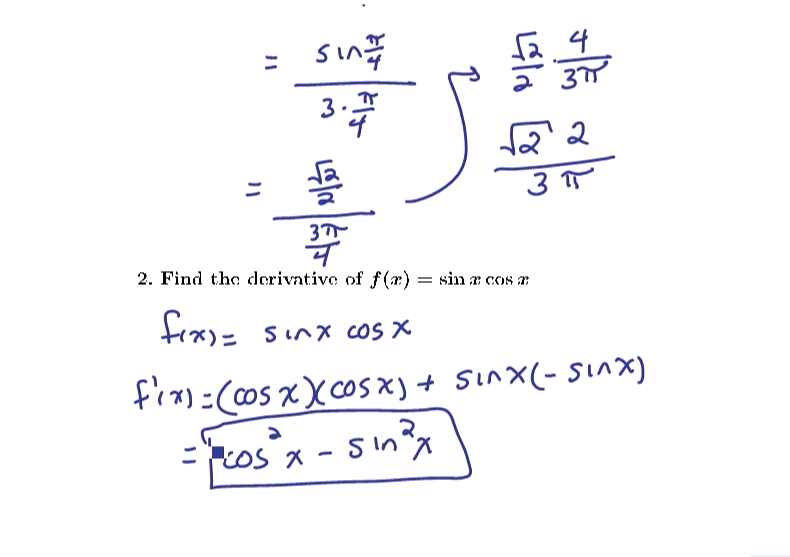
Reviewing the chain rule and the derivatives and limits of trigonometric functions
Related rates problems, differentials, linear and quadratic approximations
Review of limits and derivatives of inverse trigonometric functions
Mean Value Theorem and using derivatives to find the shape of curves
Properties and derivatives of inverse trigonometric functions

Derivatives of trigonometric functions and using the Chain Rule

Derivatives of trigonometric functions and using the Chain Rule

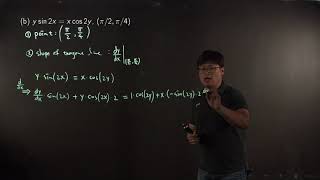
Implicit differentiation and finding tangent lines

Properties and derivatives of inverse trigonometric functions
Derivatives of exponential and logarithmic functions and the exponential model

Derivatives of exponential and logarithmic functions and the exponential model

Using derivatives to find properties of graphs
Using derivatives to find properties of graphs

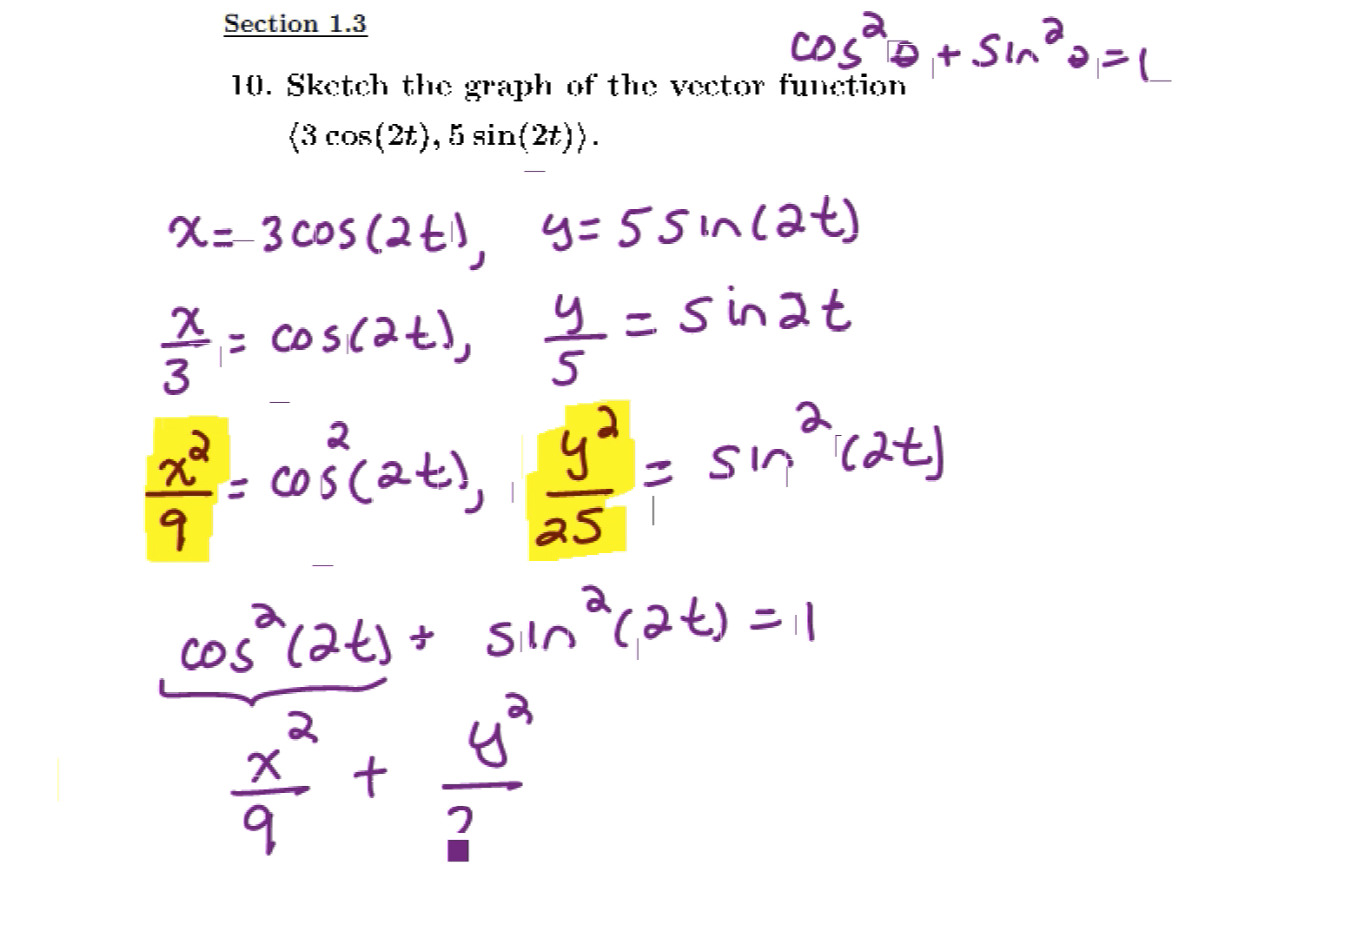
Converting parametric equations into a Cartesian equation and graphing

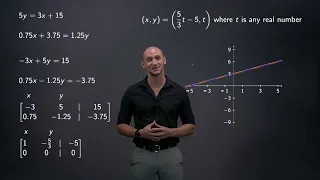
Find the Cartesian form and sketch the graph for the parametric equation of a line

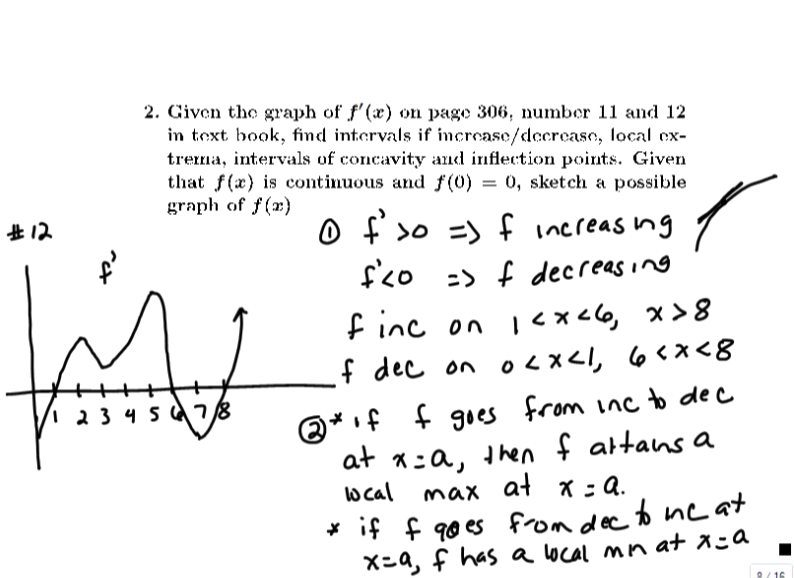
Using the graph of a function to sketch a graph of its derivative

Finding a Cartesian equation for a parametric equation and graphing it

Finding the derivatives of compositions of functions from their graphs
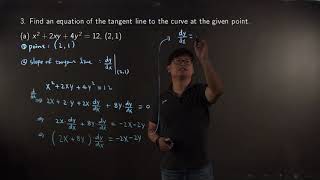
Finding a tangent line to an curve defined implicitly
Finding a tangent line to an curve defined implicitly
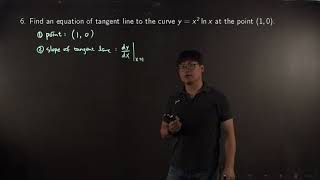
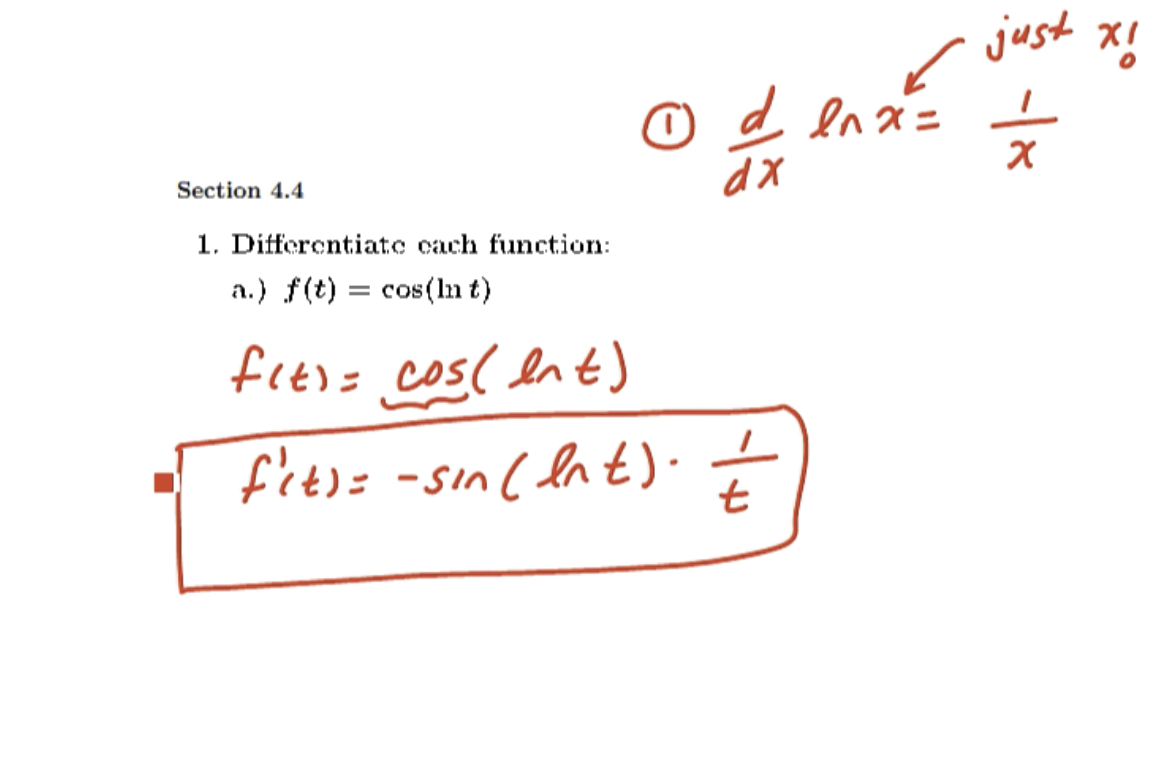
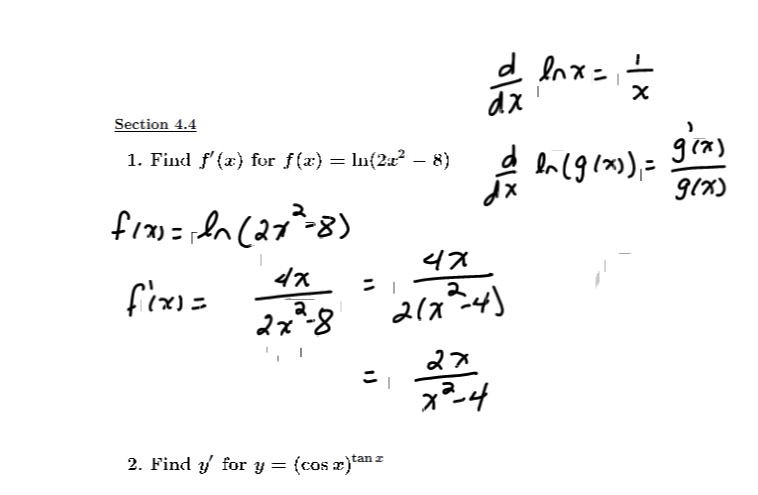
Finding the equation of a tangent line to a function containing a logarithm
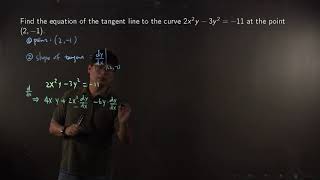
Finding the equation of a tangent line to an implicit function

Finding where a function has horizontal tangent lines

Using a linear approximation to approximate the value of a function

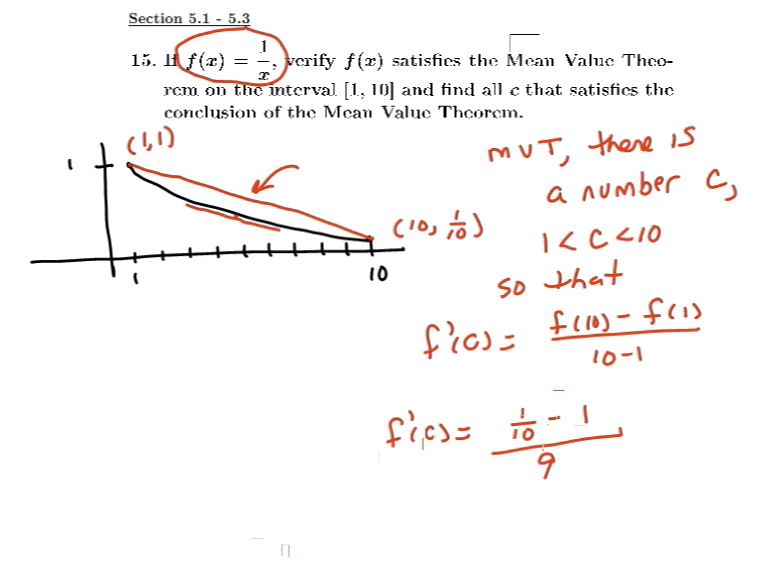
Finding a number that satisfies the conclusion of the Mean Value Theorem on an interval

Finding a number that satisfies the conclusion of the Mean Value Theorem on an interval

Determining the properties of a function from the graph of its derivative

Using a linear approximation to estimate the value of a function

Converting parametric equations into a Cartesian equation and graphing

Converting parametric equations into a Cartesian equation and graphing

Converting parametric equations into a Cartesian equation and graphing

Converting parametric equations into a Cartesian equation and graphing
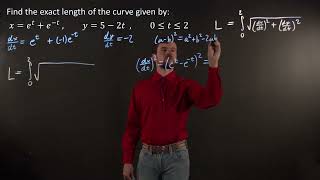
Finding the length of a curve given by parametric equations

Finding the surface area of a rotated parametric curve
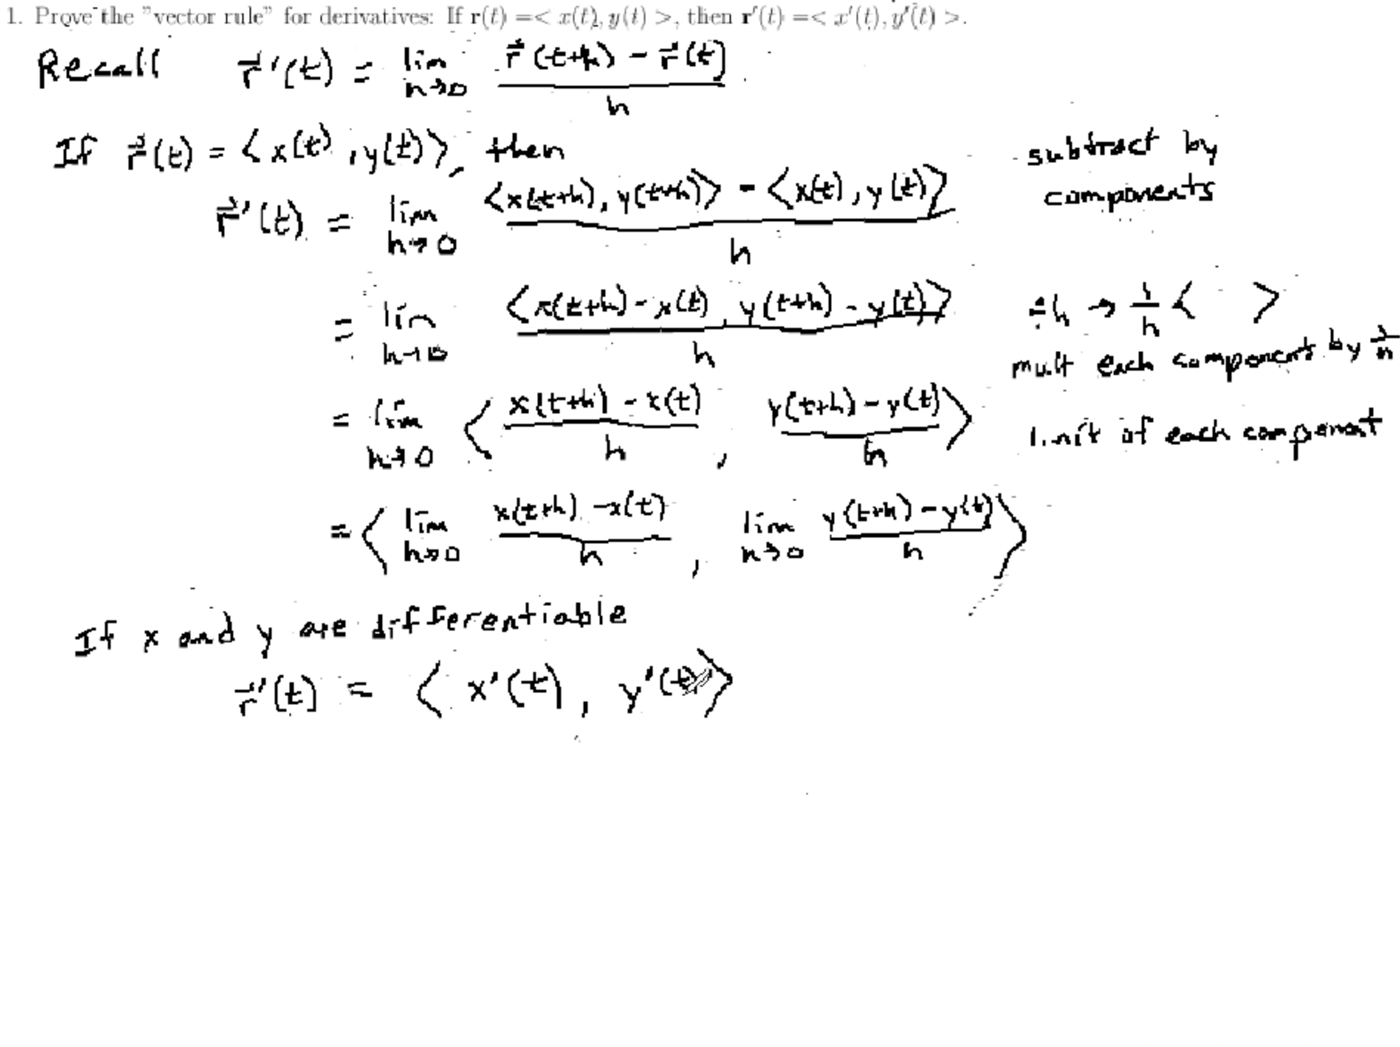
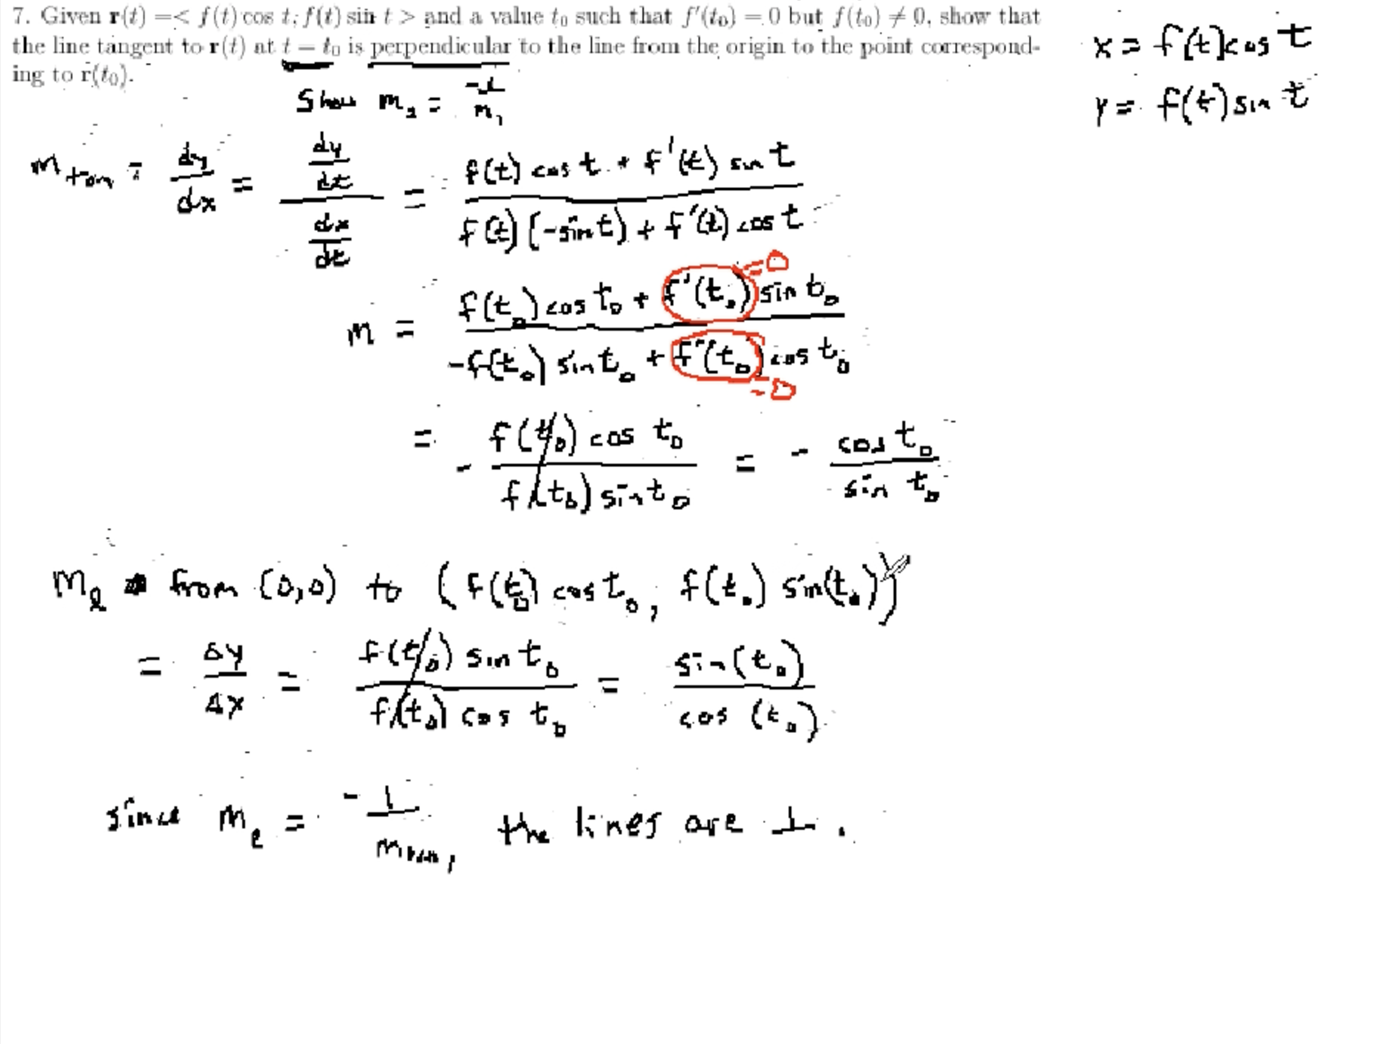
Proving facts about the derivatives of vector functions including the product rule
Review of limits and derivatives of inverse trigonometric functions
Reviewing the chain rule and the derivatives and limits of trigonometric functions
Related rates problems, differentials, linear and quadratic approximations
Mean Value Theorem and using derivatives to find the shape of curves
Properties of inverse trig functions and the derivative of arctangent
Properties and derivatives of inverse trigonometric functions

Proving facts about differentials including a product rule
Derivatives of trigonometric functions and using the Chain Rule
Derivatives of trigonometric functions and using the Chain Rule
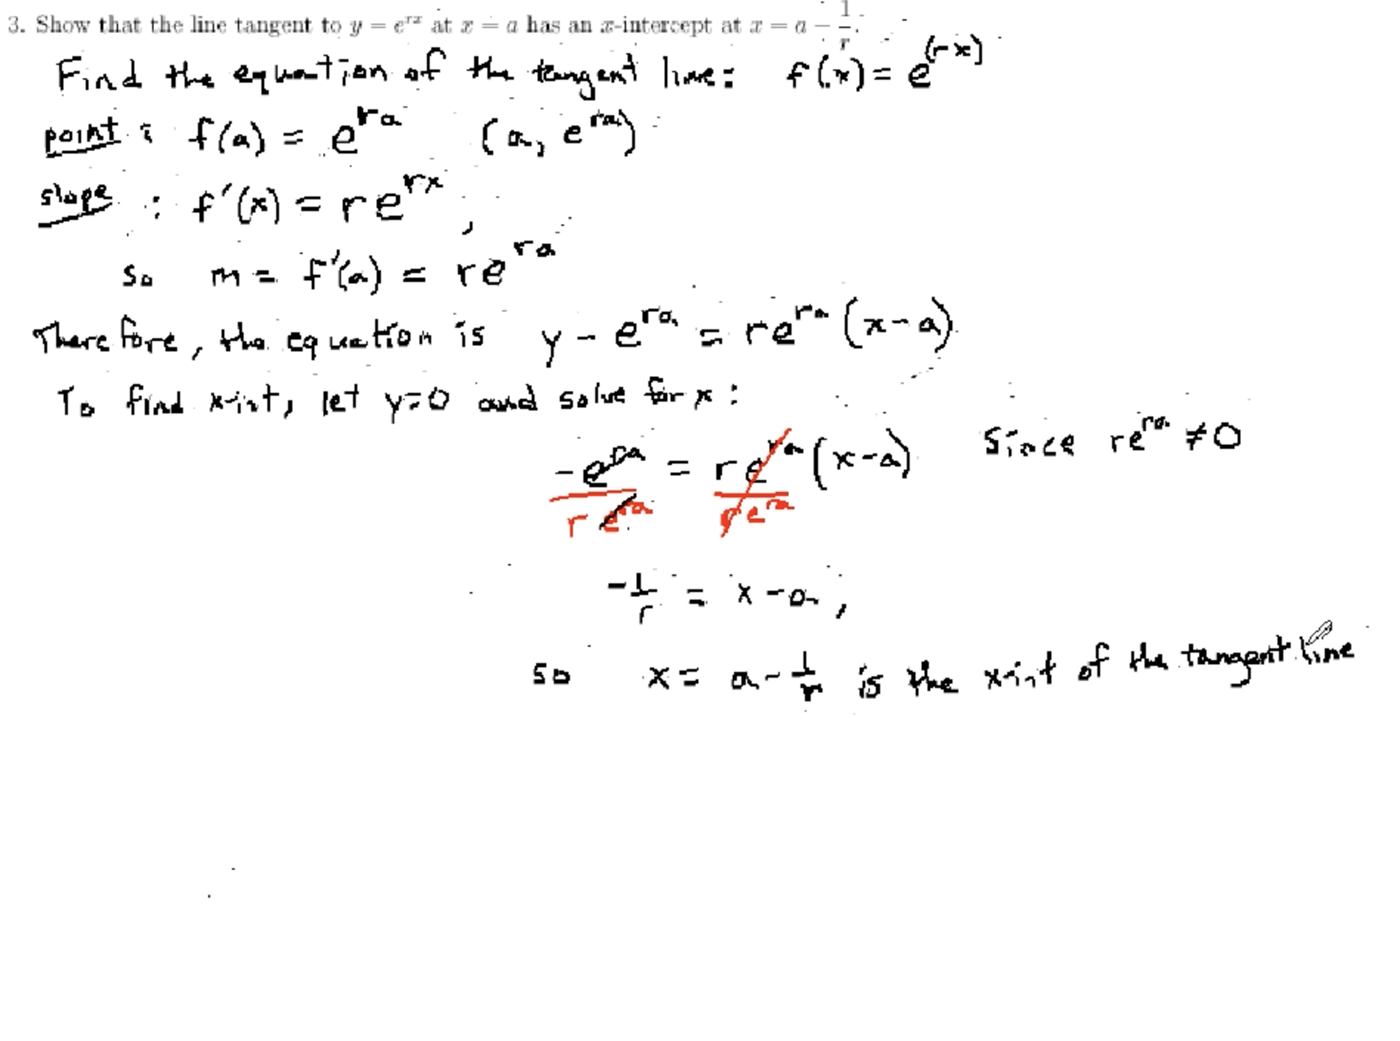
Examples involving the tangent line to an exponential function and finding the derivative of hyperbolic cosine
Implicit differentiation and finding tangent lines
Properties and derivatives of inverse trigonometric functions
Derivatives of exponential and logarithmic functions and the exponential model
Using derivatives to find properties of graphs
Using derivatives to find properties of graphs
What the derivatives of a function tell us about the shape of its graph
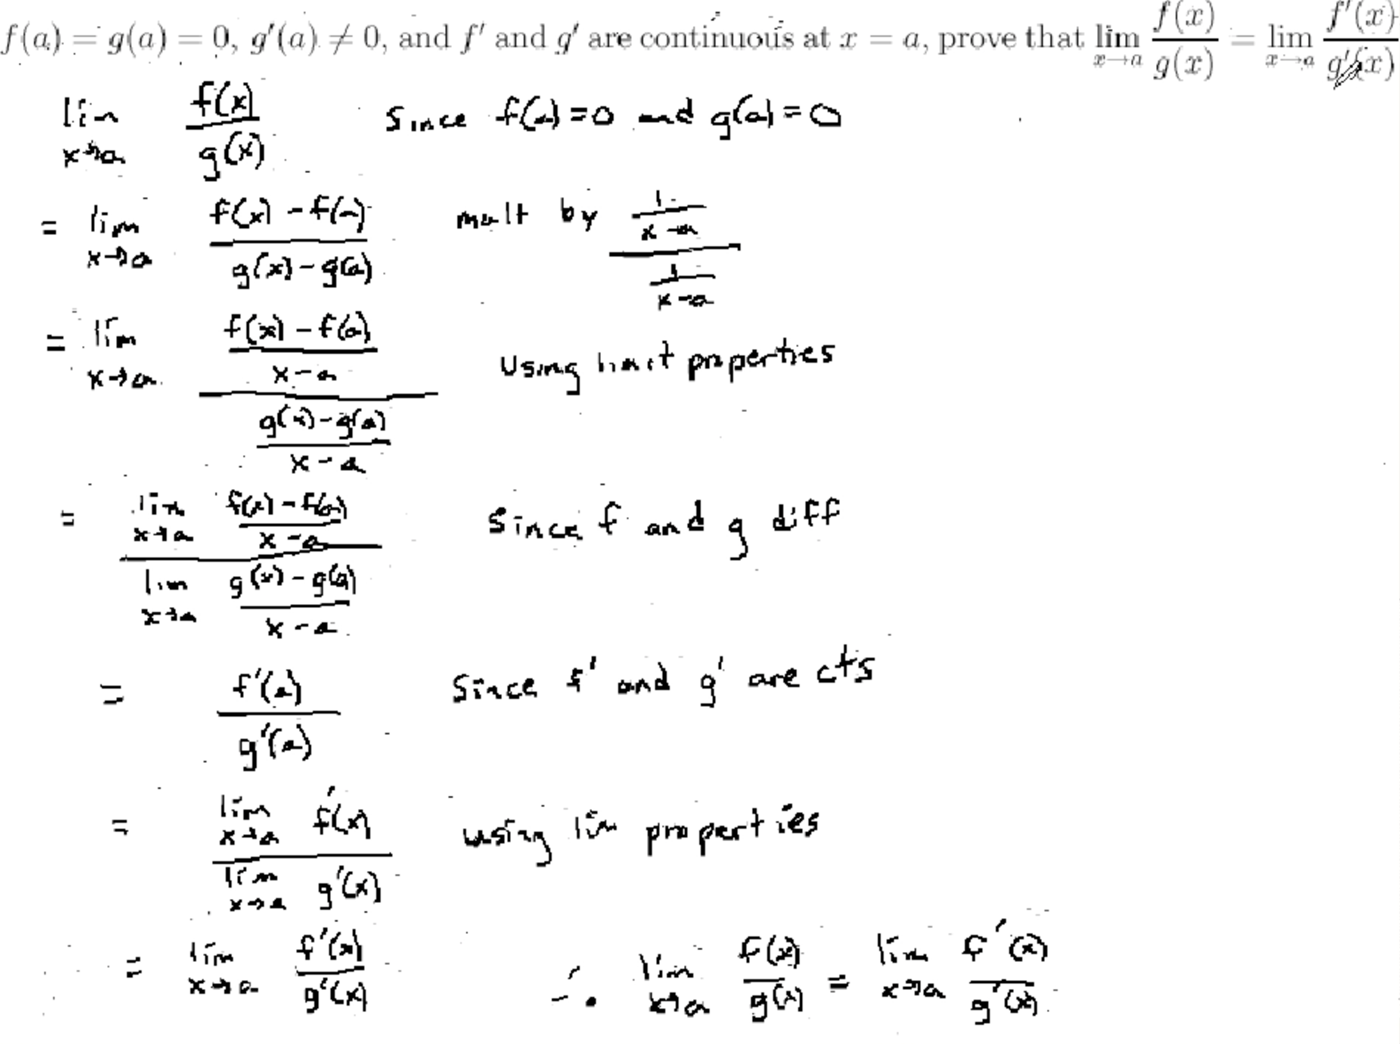
Proving L'Hospital's Rule and using it to evaluate limits

Optimizing values in word problems
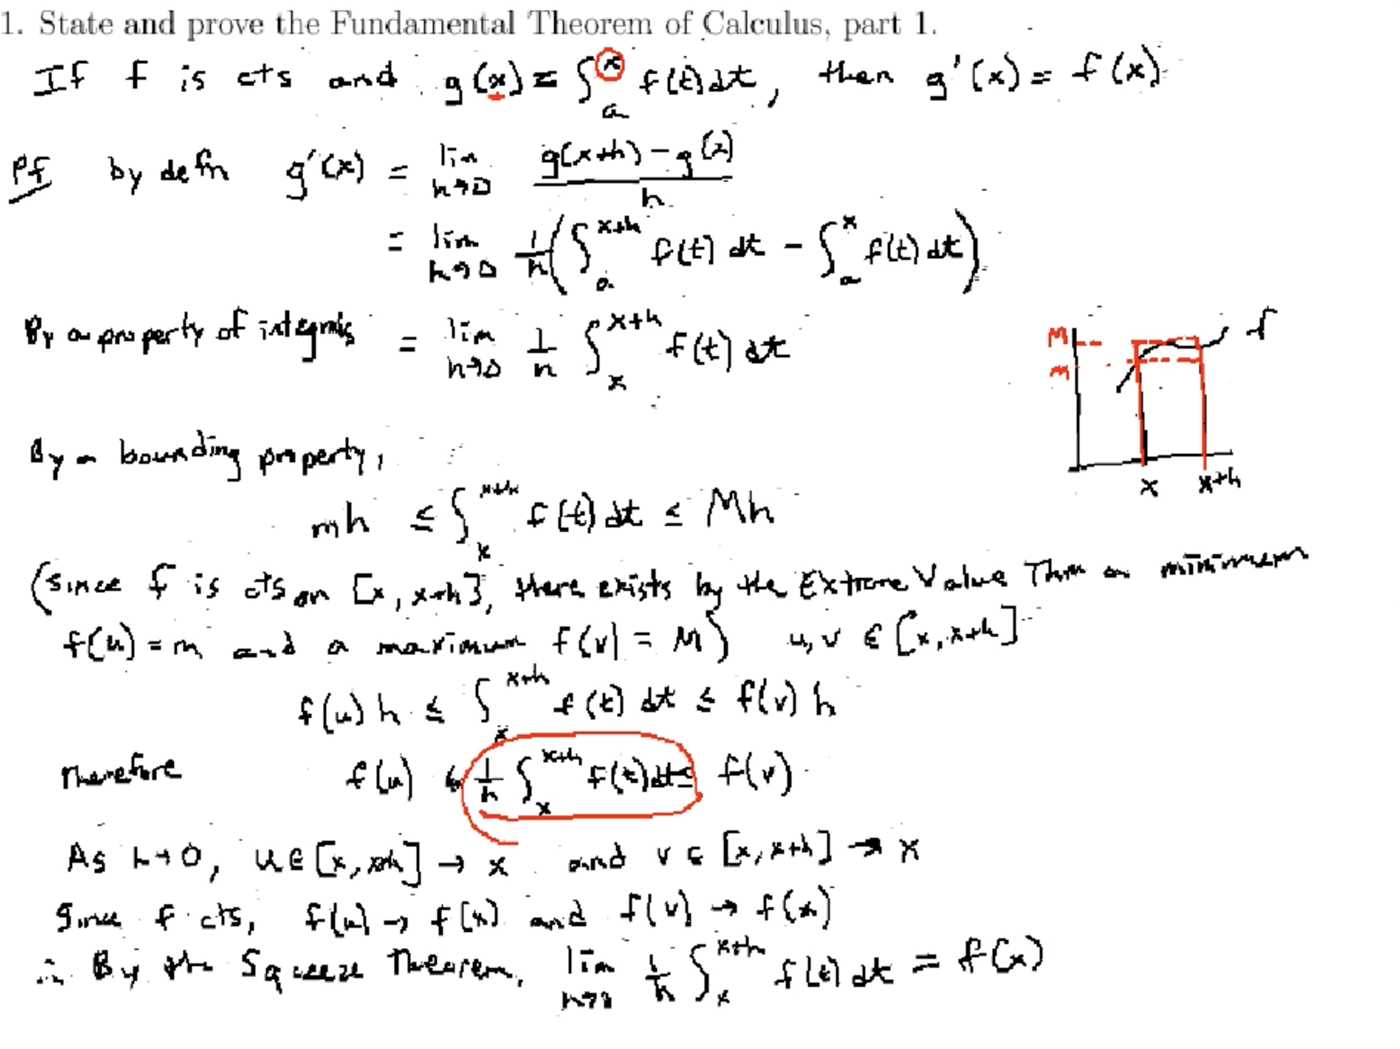
Proving and then applying the Fundamental Theorem of Calculus

Finding a vector equation for the tangent line to a three-dimensional vector function

Evaluating a line integral along half a circle

Evaluating a line integral along a curve in space

Evaluating a line integral along a curve

Evaluating a line integral along a curve

Evaluating a line integral along a curve in space

Evaluating a line integral of a vector field along an curve

Evaluating a line integral of a vector field along a curve in space

Using a line integral to find the work done by a force field moving a particle along a curve

Graphing a piecewise function using Python

Solving a multistep word problem in Python and graphing the resulting function

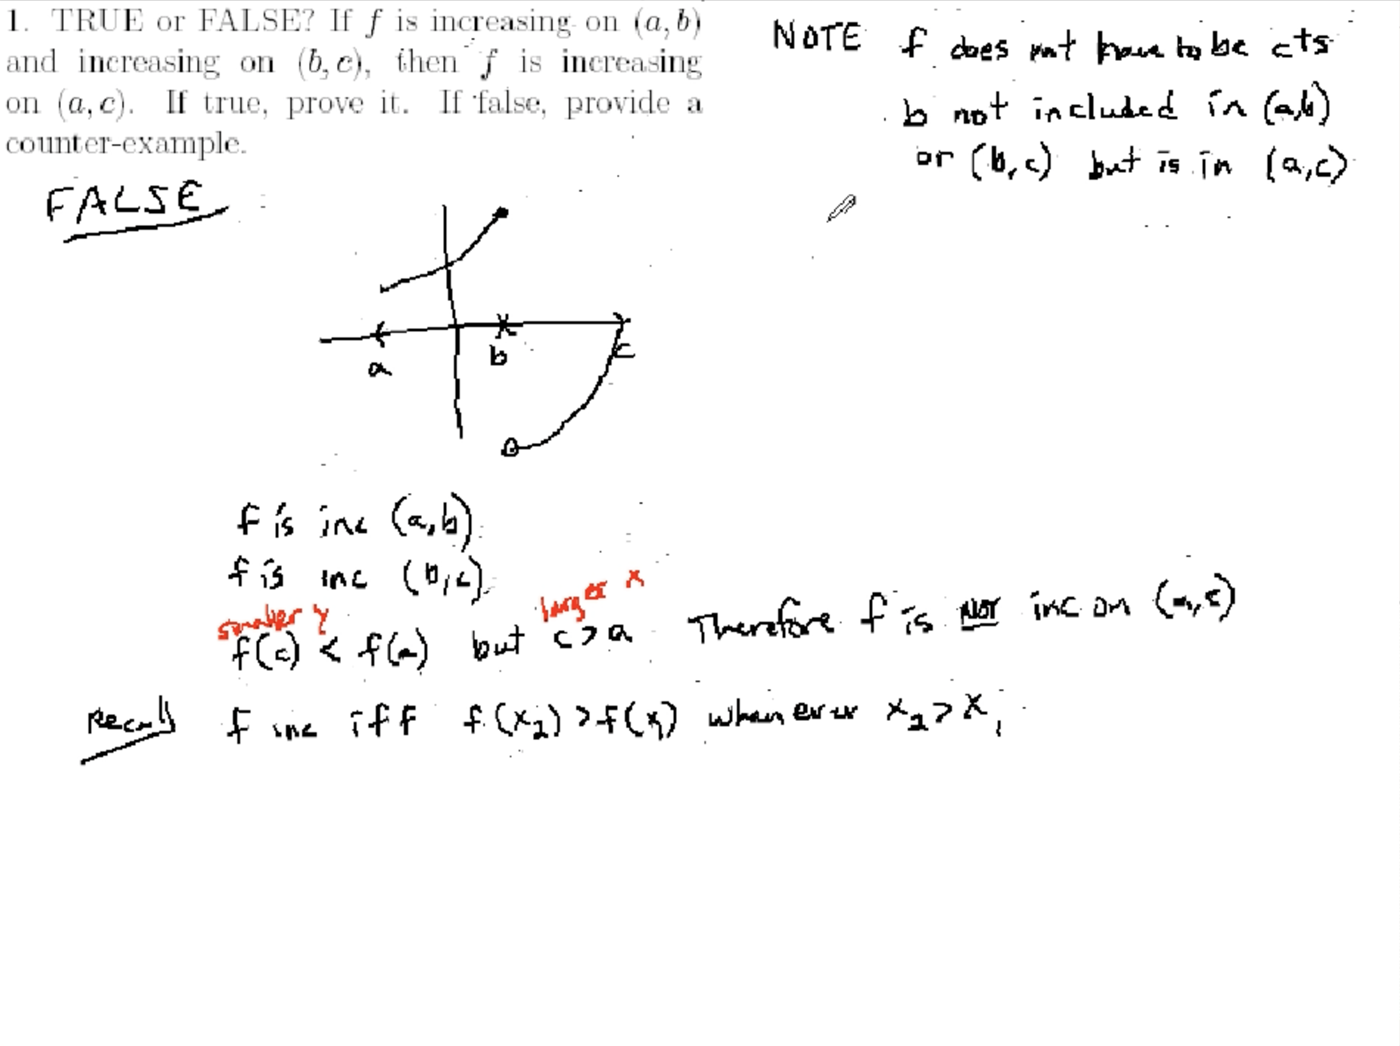
Using Python to find the intervals where a function is increasing or decreasing

Finding derivatives in Python and solving for the rate of change of a force

Using Python to numerically estimate a limit, graphically estimate a limit, and find the exact limit

Using Python's list comprehension tool to find several higher order derivatives of a function at once
Review of limits and derivatives of inverse trigonometric functions
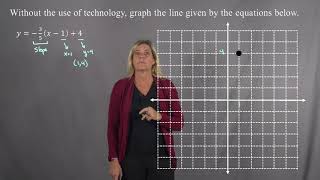
Graphing a line without using technology

Graphing a line without using technology

Graphing a line without using technology

Writing a function for the value of an item depreciating linearly over time
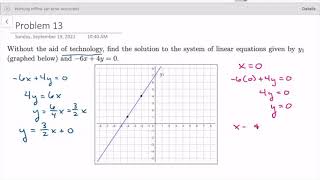
Finding the solution to a system of linear equations by graphing

Explaining how to graph linear inequalities

Graphing two linear inequalities

Sketching the solution set and finding the corner points for a system of linear inequalities

Graphing the solution set of an inequality with two variables

Graphing the solution set of an inequality with two variables

Graphing the solution set of system of linear inequalities

Using a graph to find specific values of a function
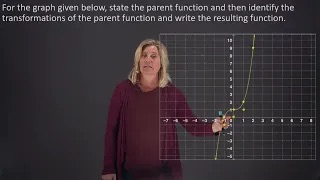
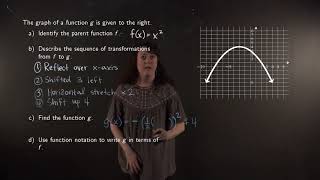
Identifying the parent function and transformations for a given graph
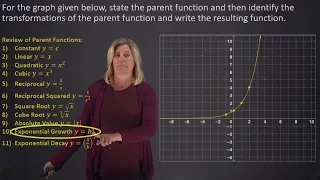
Identifying the parent function and transformations for a given graph
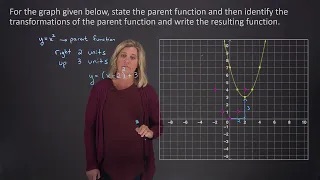
Identifying the parent function and transformations for a given graph

Identifying the parent function and transformations for a given graph

Drawing the graph of a transformed function given the original graph

Evaluating compositions of two given functions and the graph of a third function

Using the Horizontal Line Test to determine if graphs represent invertible functions

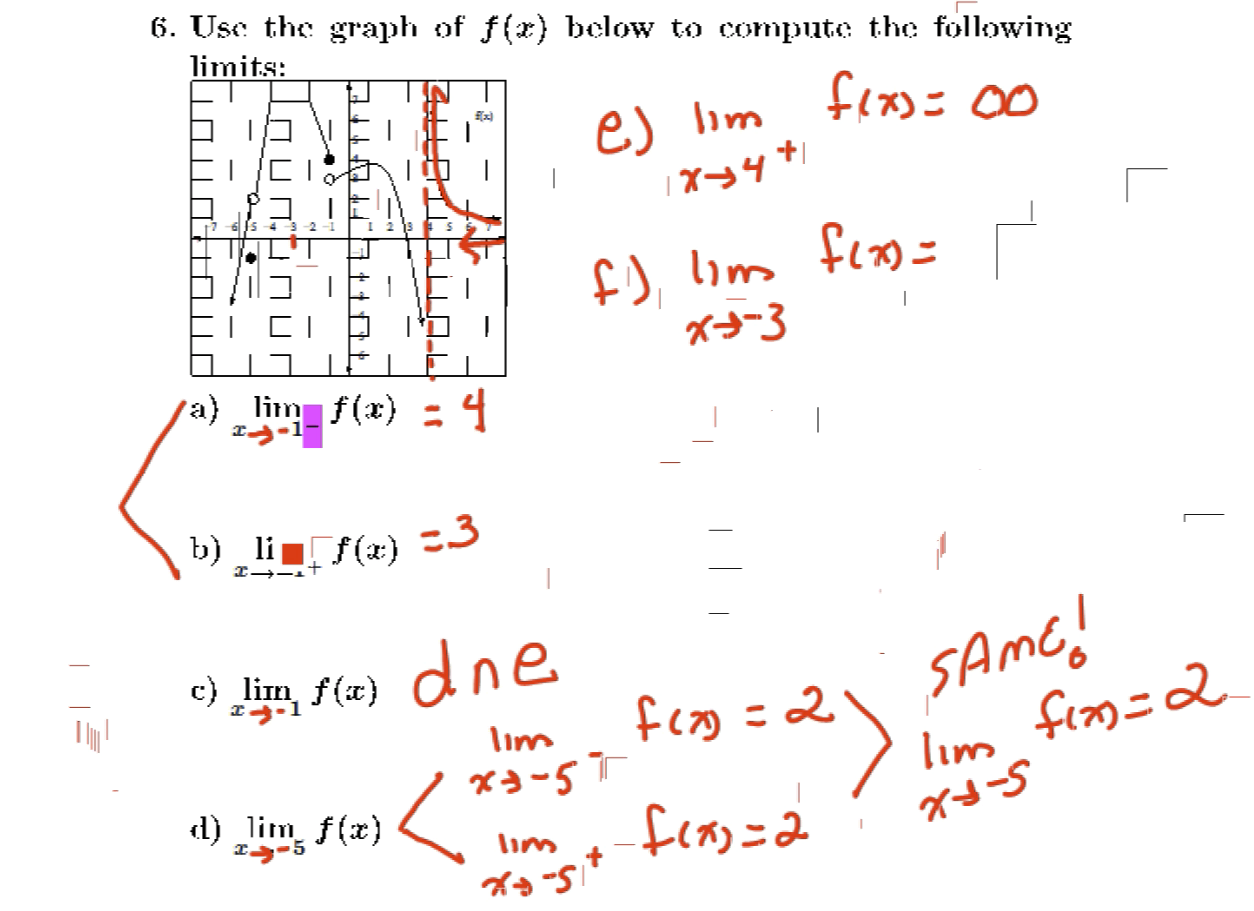
Finding limits from the graph of a piecewise function

Determining where a piecewise function is continuous from its graph

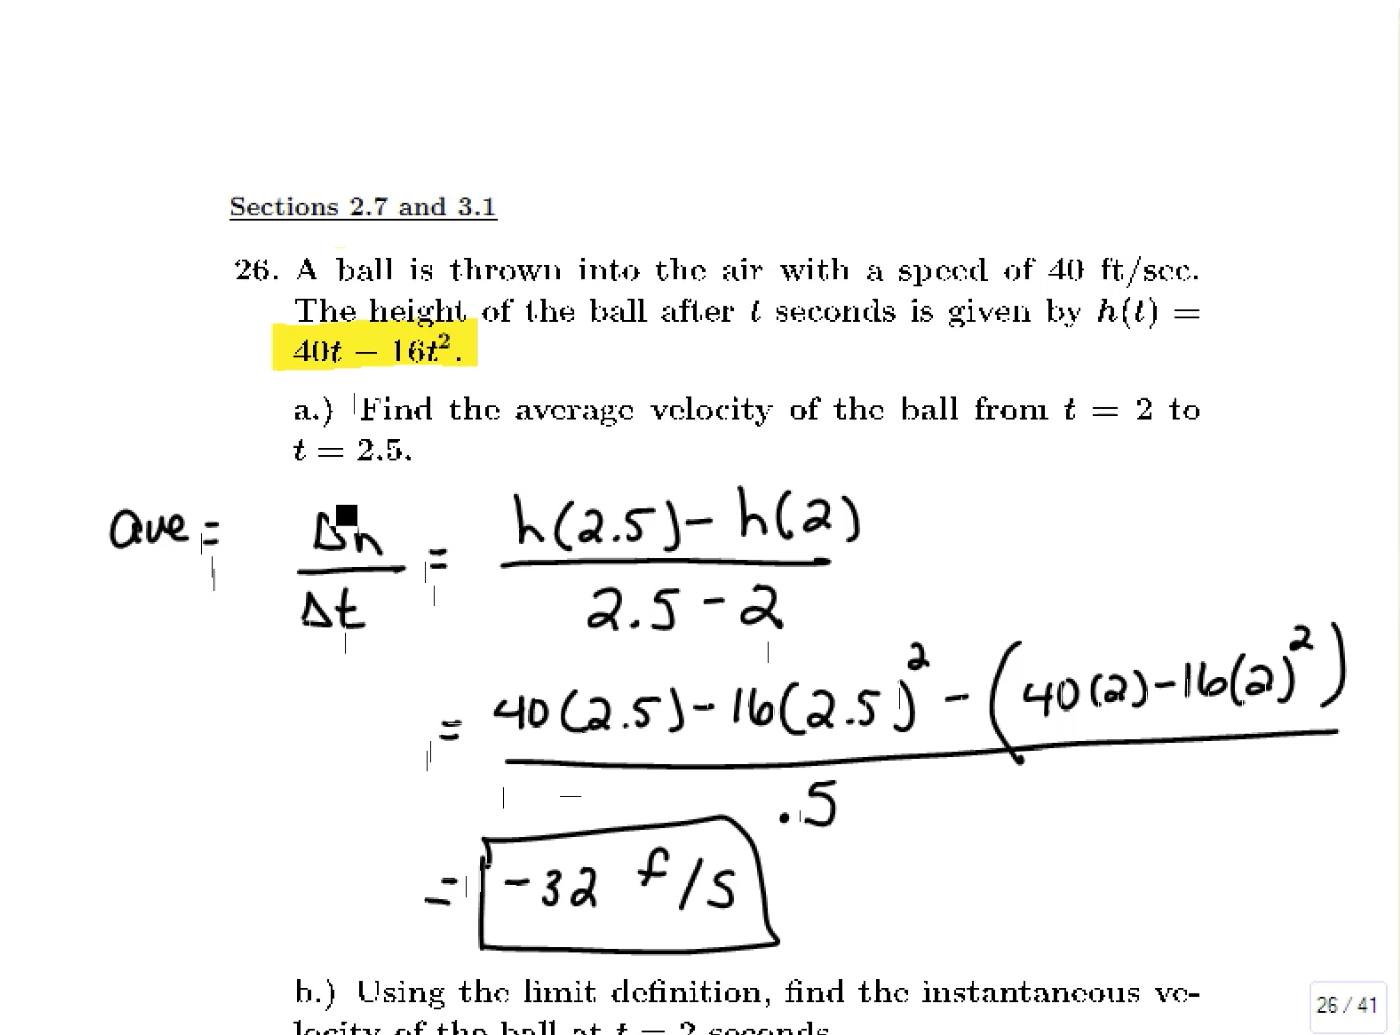
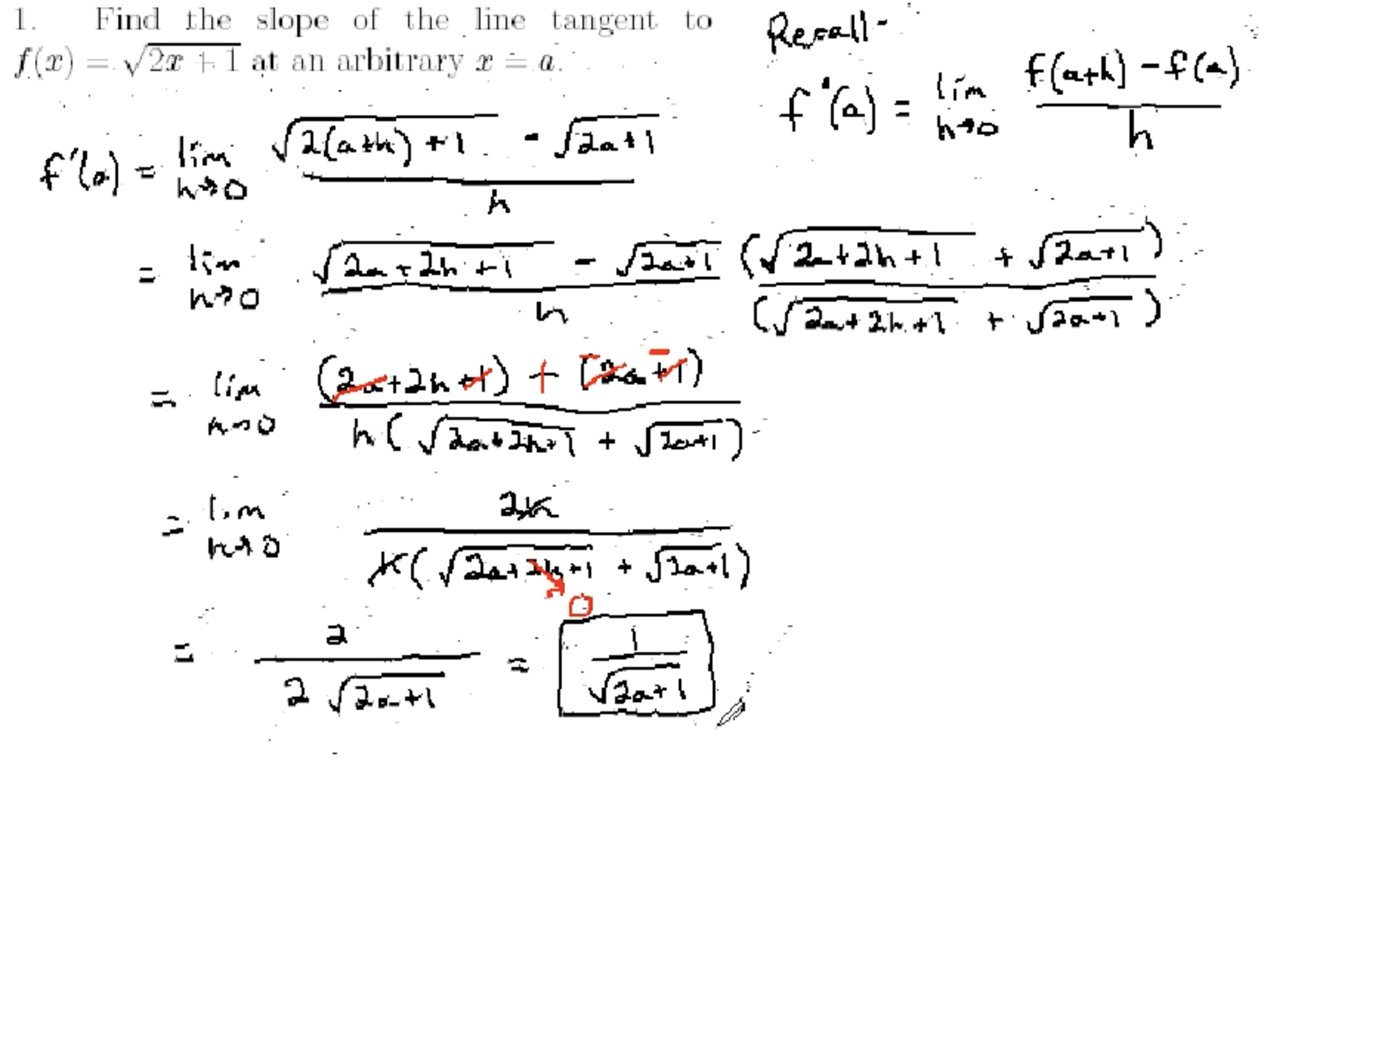
Finding the exact value of the instantaneous rate of change

Finding the exact value of the instantaneous rate of change

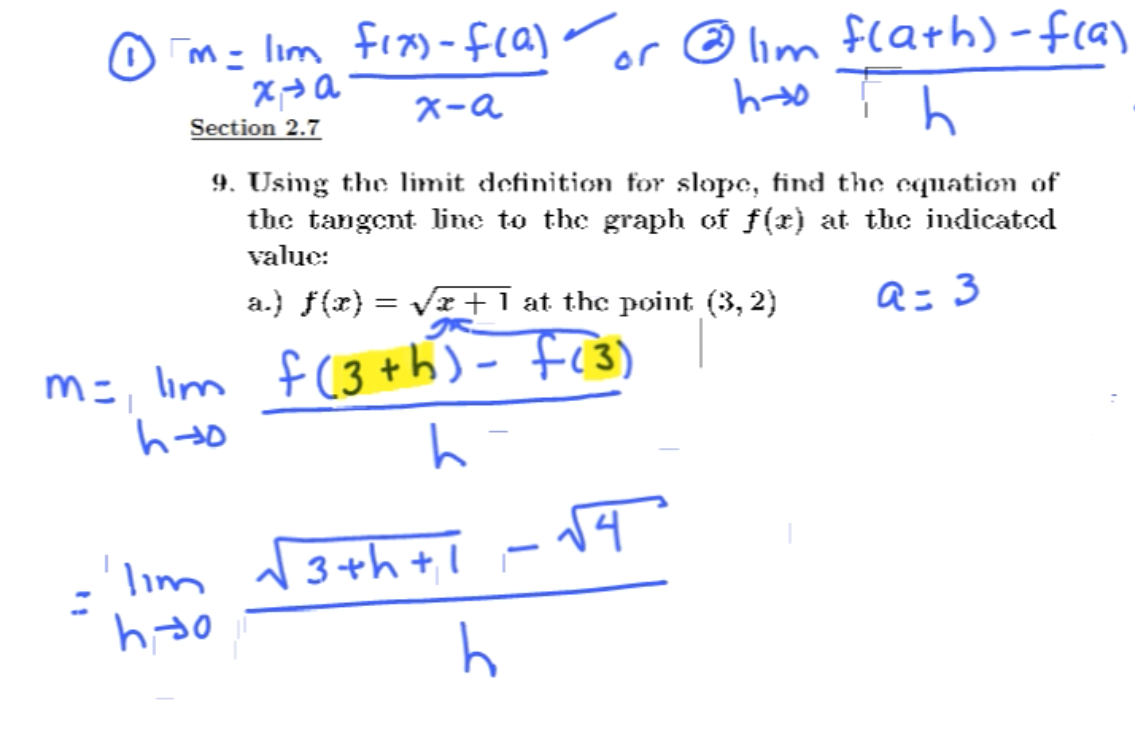
Finding the equation of the tangent line to a function using the limit definition

Finding the derivative a function with a power, exponential, and logarithm

Finding the derivative of a rational function by simplifying and using the power rule

Finding and evaluating derivatives using values given in a table

Finding the marginal revenue given the price-demand function for a word problem

Finding a derivative of a function with a logarithm using the Product Rule

Finding the derivative of a function with a square root and exponential using the Product Rule

Finding the derivative of a rational function using the Quotient Rule

Finding the derivative of a fraction with an exponential using the Quotient Rule

Finding a derivative using both the Product and Quotient Rule

Finding a derivative using the Product and Quotient Rule and values given in a table

Finding the derivative of both the cost function and average cost function

Finding the derivative of a function using the Generalized Power Rule

Using logarithm properties to simplify before using the Chain Rule to find a derivative

Using logarithm properties to simplify before using the Generalized Logarithm Rule to find a derivative

Using the chain rule to find derivates with some values given in a table

Finding the rate a balance is increasing for interest compounded monthly and continuously

Using the alternate form of the Chain Rule to find the derivative

Finding the derivative of a function that requires logarithmic differentiation

Using implicit differentiation to find the derivative of a function

Using implicit differentiation to find the derivative of a function

Finding the rate water is flowing into an expandable sphere given the rate a sphere is growing

Finding the rate of change of profit given the rate of increase for sales

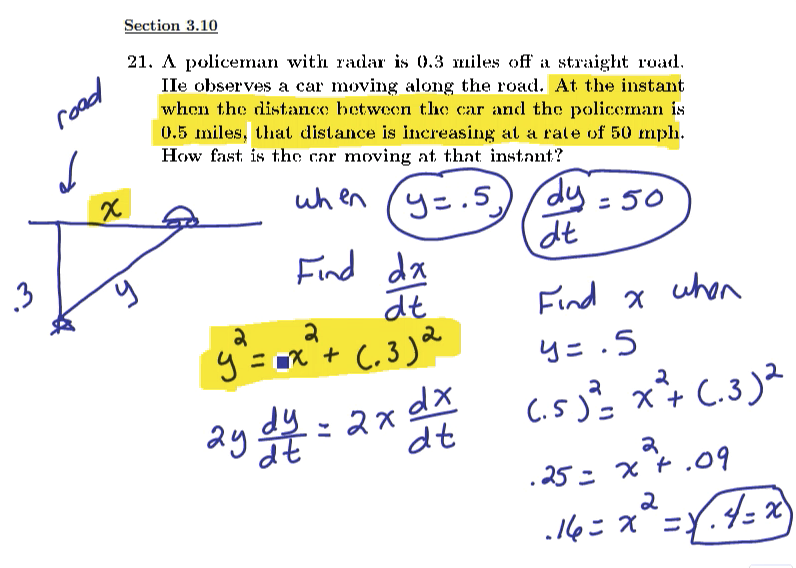
Finding how fast a ladder moves up a wall as the bottom is being pushed

Finding the critical values for several functions

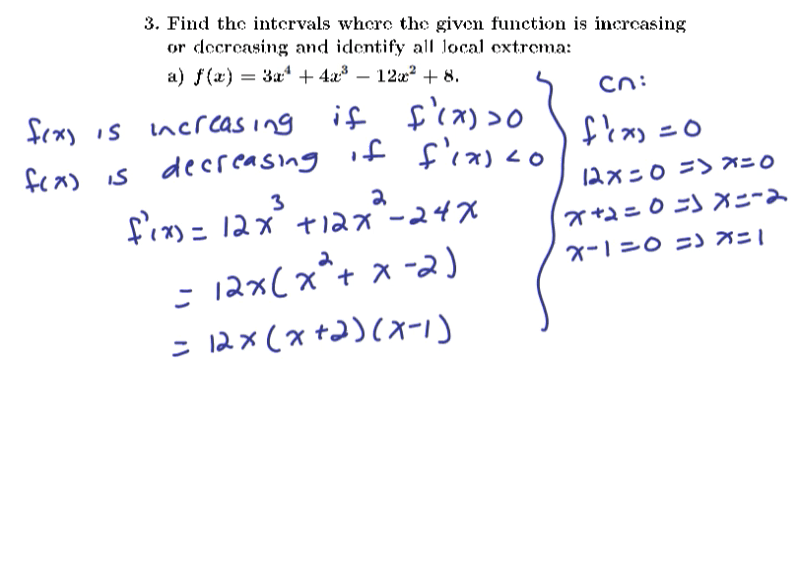
Finding the intervals where a function is increasing/decreasing and the local extrema

Finding intervals of increase/decrease and the local extema for revenue from a word problem

Using the quotient rule twice to find the second derivative of a rational function

Finding the intervals of concavity and inflection points for a function with exponentials

Determining the intervals of concavity and inflection points from the graph of a function

Using the second derivative test to find local extrema for a function

Finding the absolute maximum and minimum of a rational function on two closed intervals

Finding the absolute maximum and absolute minimum of a rational function on two closed intervals

Finding the maximum product of two numbers given their sum is 100

Finding the selling price of trucks to maximize profit given the cost and price-demand functions

Finding the dimensions of the box with the largest volume given the amount of material to make the box

Finding the minimum cost of a box given the volume and cost of materials

Solving for a function given its derivate and one value

Using u-substitution in an indefinite integral to find a function from its derivative and a given vaue

Solving a related rates word problem for the rate of change of a cell's radius

Solving a related rates word problem on blood flow and the Poiseuille equation
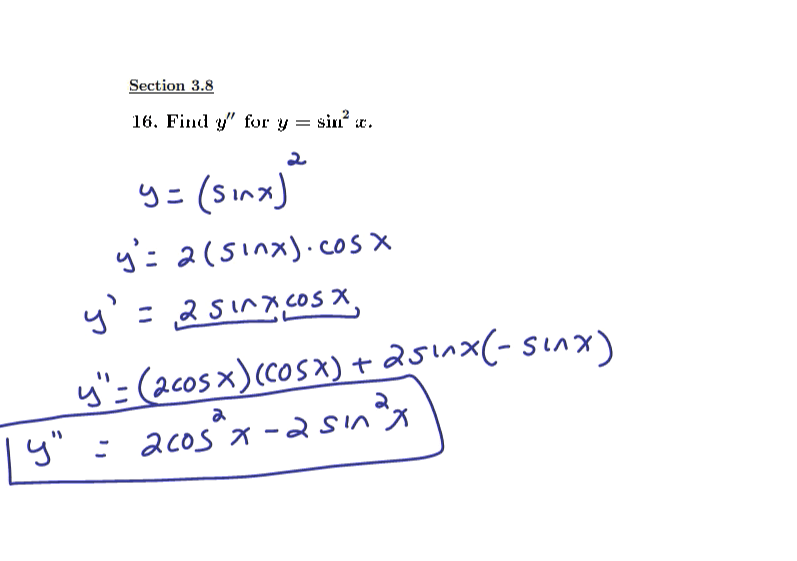
The definition of higher derivatives and solving an example
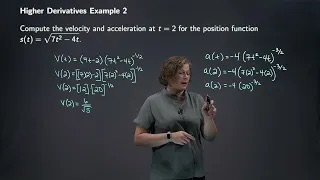
Using derivatives to find the velocity and acceleration functions from the position function
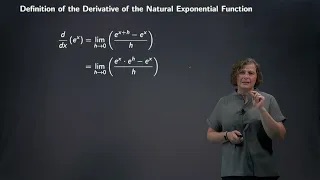
Explaining the formulas for the derivatives of exponential functions

Calculating the derivative of a function with exponentials using the chain and product rule

Calculating a derivative of a quotient with an exponential function
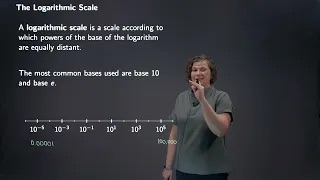
Explaining the definition of logarithmic scale and double-log plots
Explaining the logarithmic scale and a semilog plot
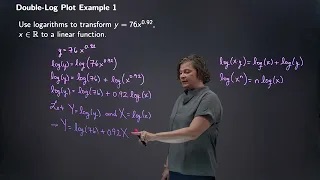
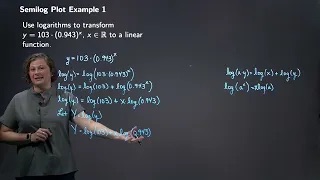
Using logarithms to transform a power function into a linear function
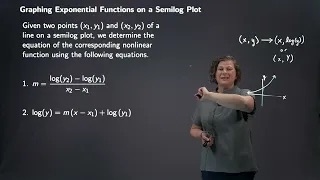
Using logarithms to transform an exponential function to a linear function

Explaining the Sandwich (or Squeeze) Theorem with a graphical example

Solving a limit at infinity using the Sandwich (or Squeeze) Theorem

Using a linear approximation and the per capita growth rate to estimate population size

Solving an optimization word problem using a derivative
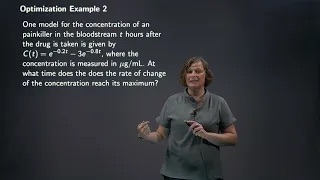
Using the second derivative to find the maximum rate of change in a word problem
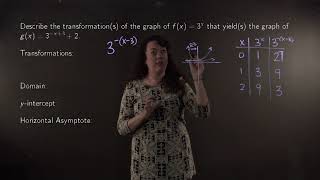
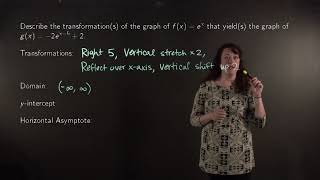
Identifying the parent function and transformations of a function
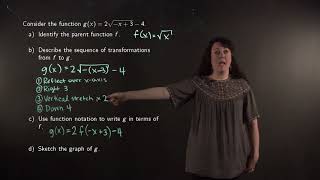
Identifying the parent function and transformations of a function
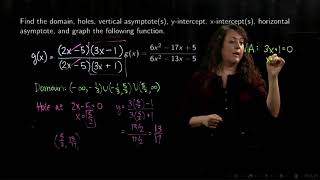
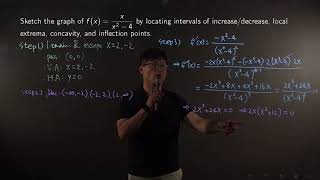
Determining the properties of a rational function and graphing it
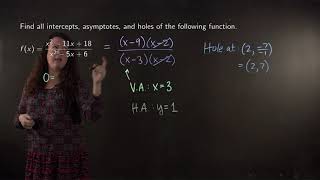
Determining the properties of a rational function and graphing it

Graphically verifying if two functions are inverses

Restricting the domain of a function so it is one-to-one and has an inverse

Determining algebraically the inverse of a function

Determining algebraically the inverse of a function

Determining algebraically the inverse of a function
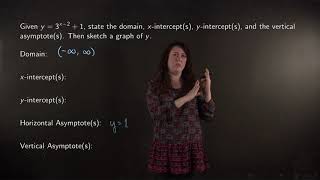
Determining properties of an exponential function
Determining properties of an exponential function
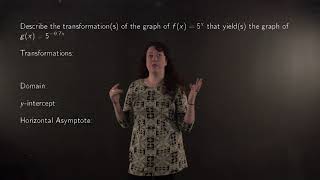
Determining properties of an exponential function
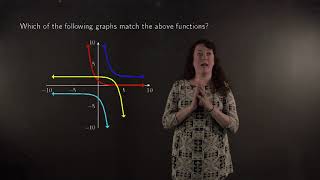
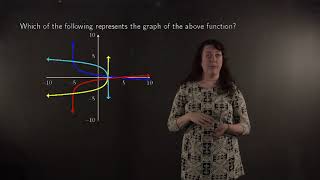
Identifying the graph of an exponential function
Determining properties of an exponential function
Determining the graph of a logarithmic function

Determining the graph of a logarithmic function

Determining the properties of a sine function and graphing it

Determining the properties of a cosine function and graphing it

Writing the equation for a sine function to match a given graph

Writing the equation for a cosine function to match a given graph

Adding and subtracting vectors graphically

Finding the properties of a transformed tangent function and graphing it

Using a graph to evaluate a function

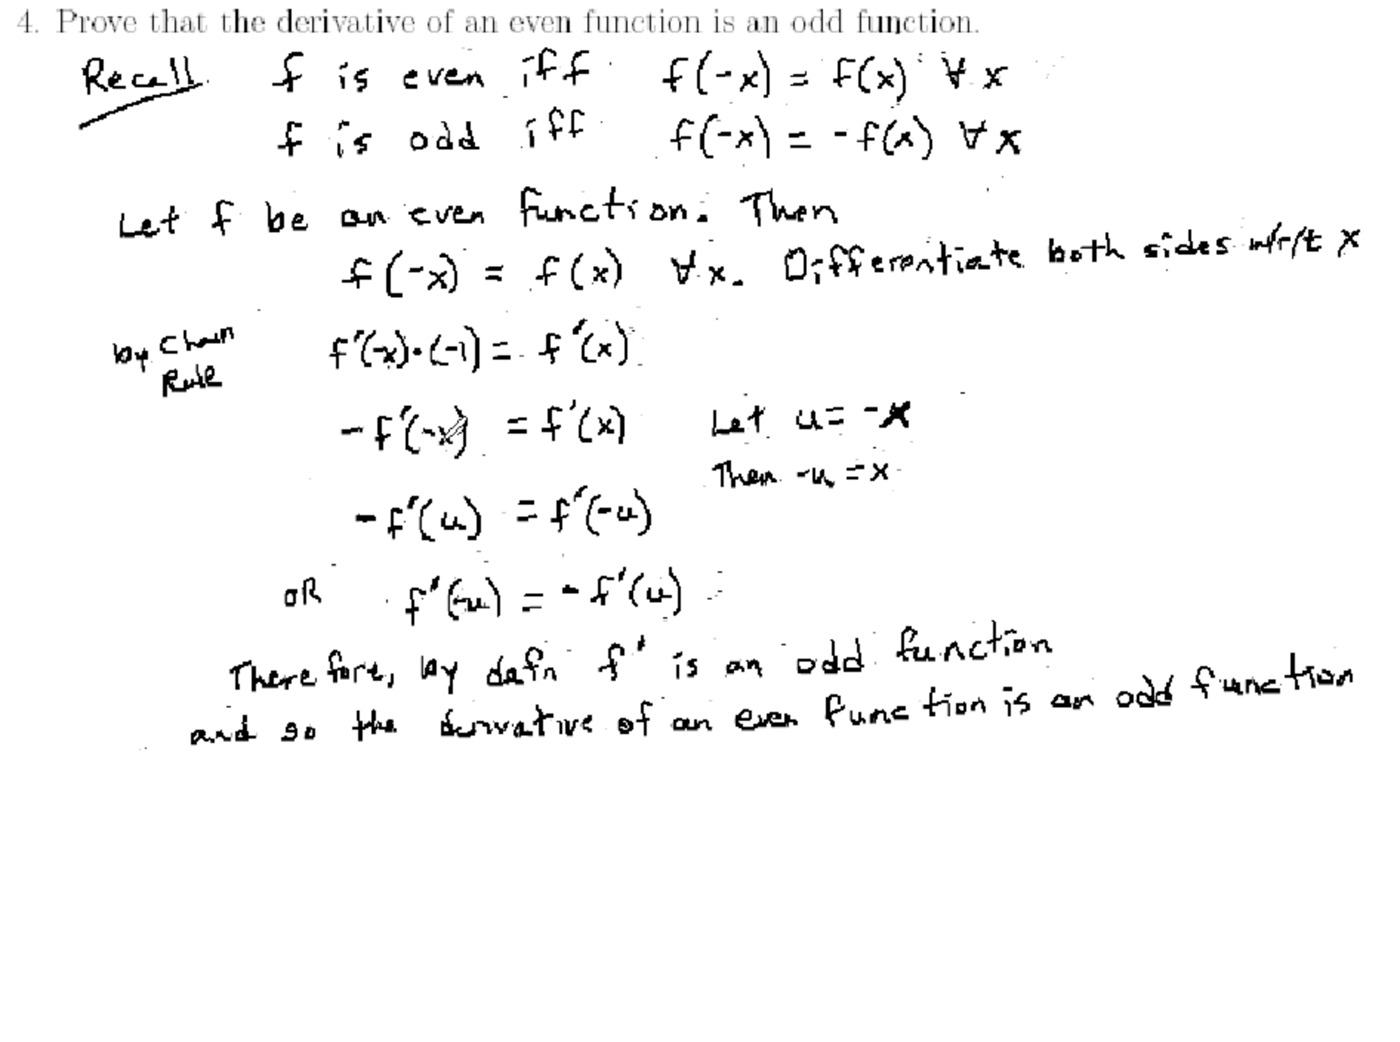
Determining if a function is even or odd

Cartesian equations and parametric equations of curves
Review of vector functions and parametric equations

Review of limits, continuity, and the Intermediate Value Theorem
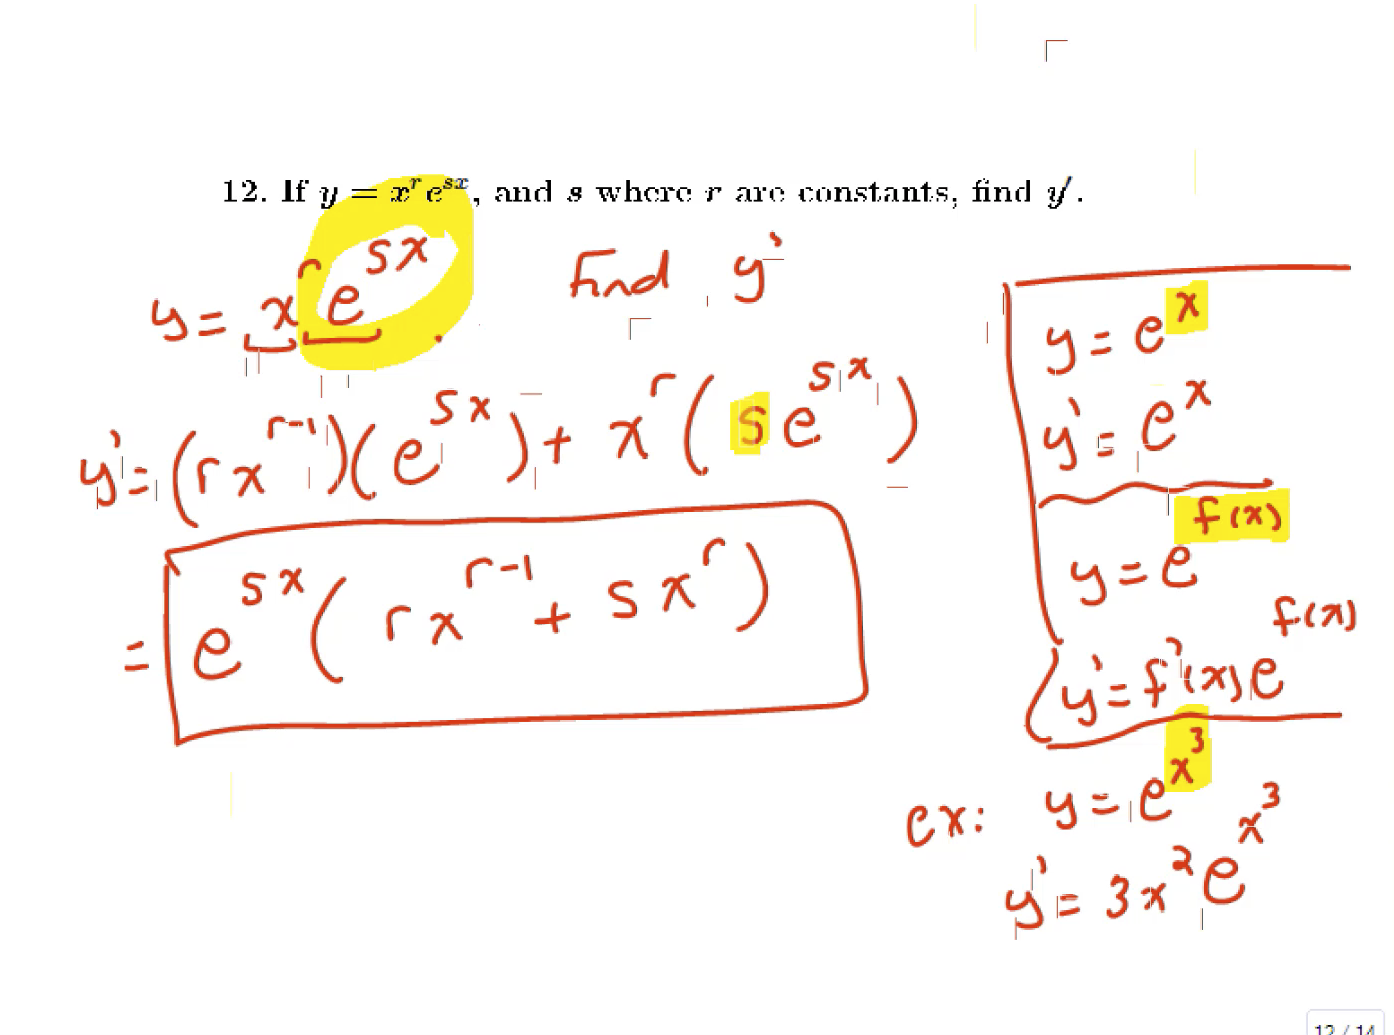
Derivatives of exponential functions and the exponential model

Optimization problems
Antiderivatives and physics applications
Evaluating limits of functions
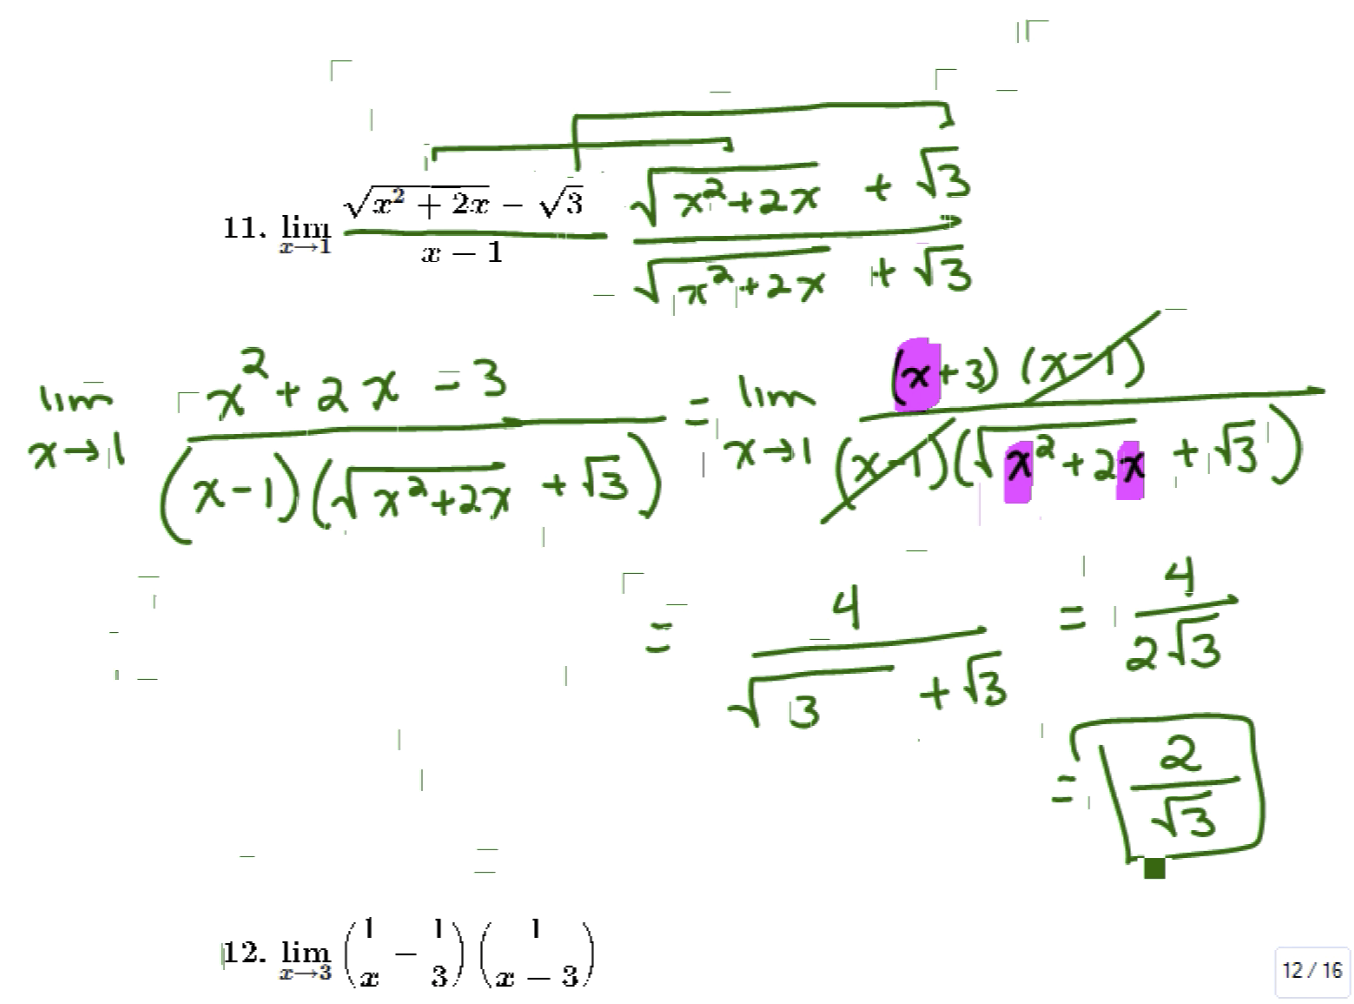
Evaluating Limits of Functions

Continuity of Functions and the Intermediate Value Theorem

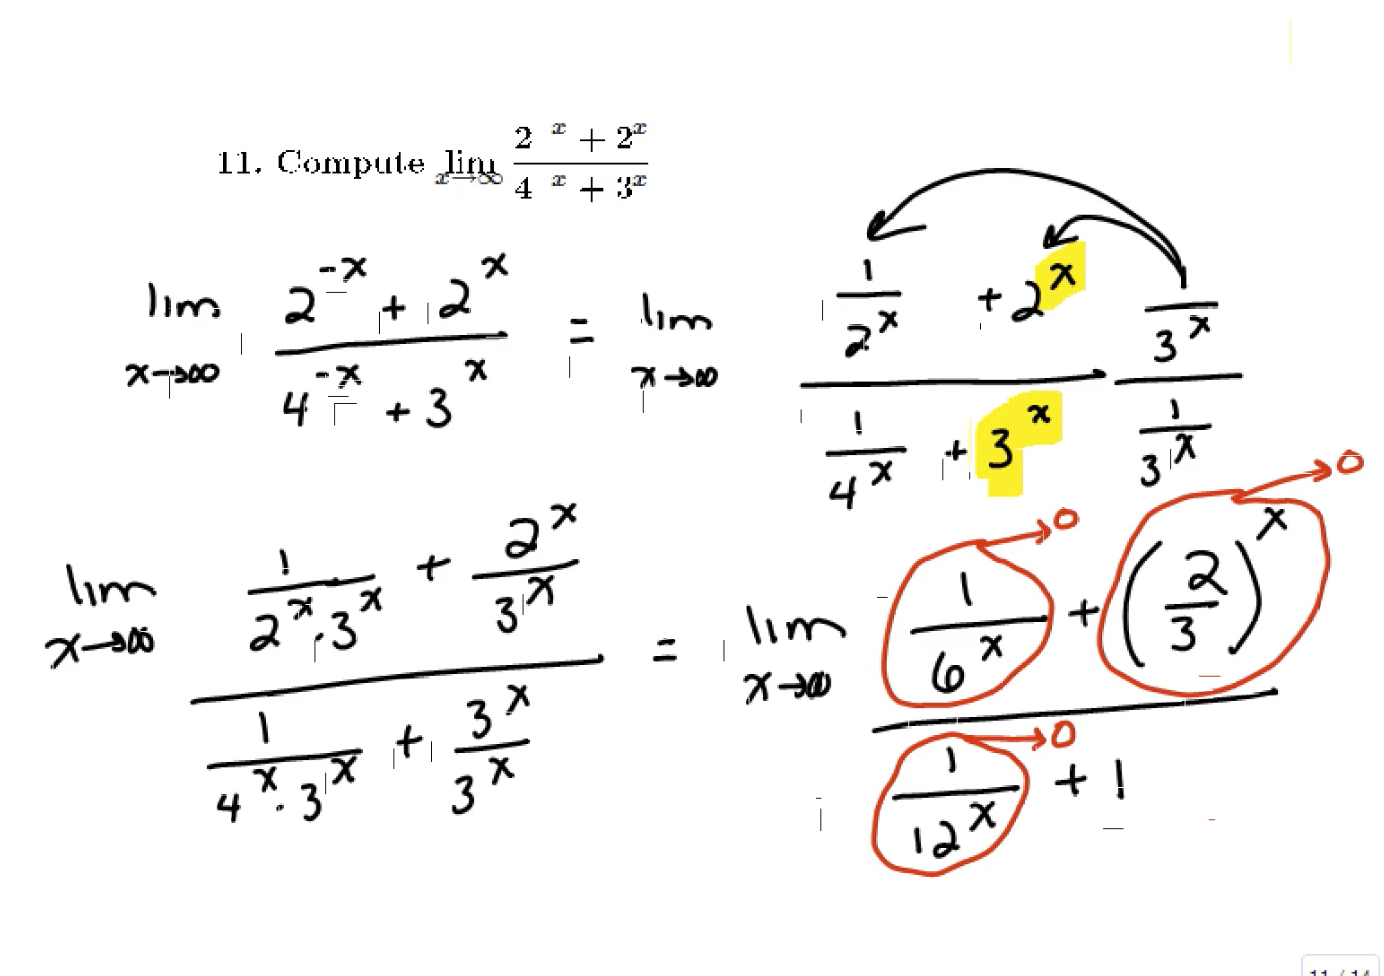
Limits at infinity and asymptotes, along with physics applications
Limits at infinity, asymptotes, and tangent lines
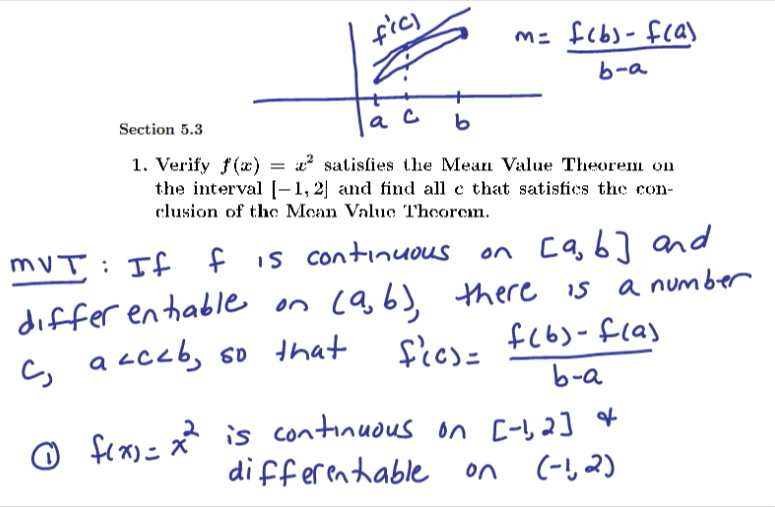
Mean Value Theorem and properties of a graph
Mean Value Theorem and properties of a graph
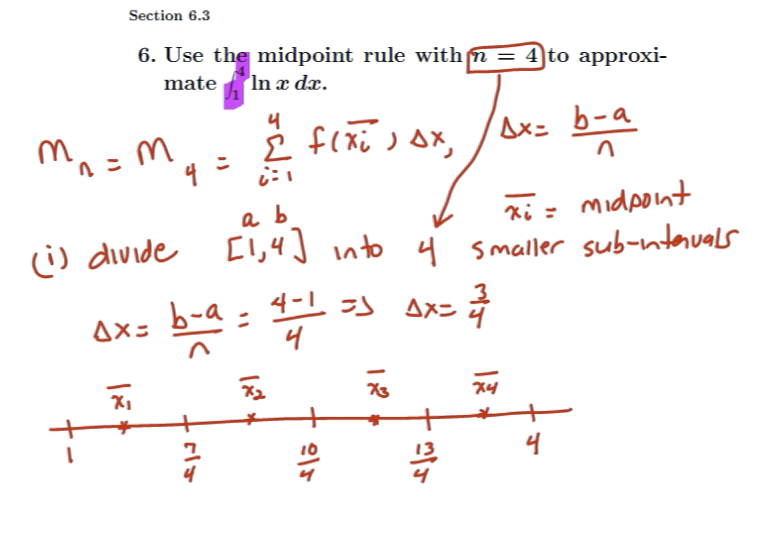
Using Reimann sums and the Fundamental Theorem of Calculus
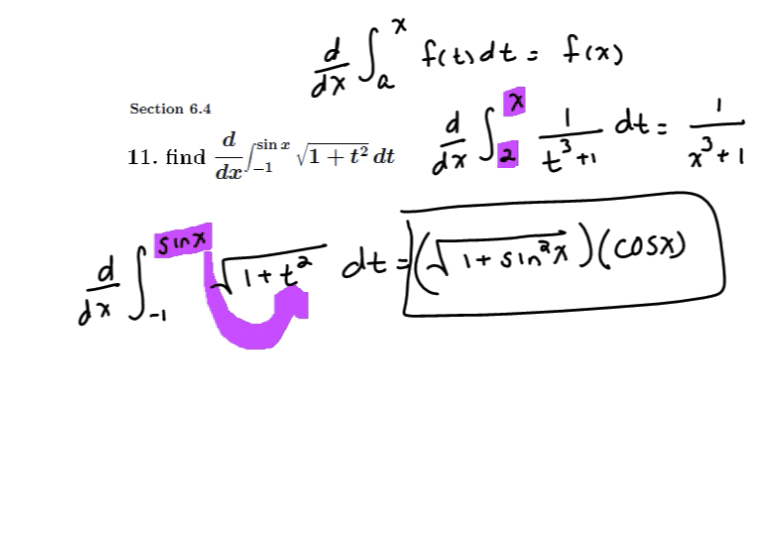
Using Riemann sums and the Fundamental Theorem of Calculus

Finding a Cartesian equation for a parametric curve

Finding the derivative of a function using the limit definition

Finding the derivative of a function using the limit definition

Finding the derivative of a function using the limit definition

Differentiating functions using the Power Rule

Differentiating a function using the Power Rule

Differentiating a function with an exponential function and using the Power Rule

Using the Product Rule to differentiate a function

Using the Quotient Rule to differentiate a function

Using the Quotient Rule to differentiate a rational function

Using the Product Rule to differentiate a function

Using the Product and Quotient Rules to differentiate a function

Using the Product Rule to find a first and second derivative

Using the Chain Rule to differentiate functions

Using the Chain Rule to differentiate functions with exponential and trigonometric functions

Using the Chain Rule to differentiate a function containing trigonometric functions

Using the Chain Rule to find a first and second derivative

Using the Chain Rule to evaluate the derivative of a composition of functions

Using the Chain Rule to evaluate the derivative of a composition of functions

Using the Chain Rule to find the pattern for a higher order derivative

Using the Chain Rule to find the pattern for a higher order derivative

Using logarithmic differentiation to find the derivative of a function

Using logarithmic differentiation to find the derivative of a function

Using logarithmic differentiation to find the derivative of a function

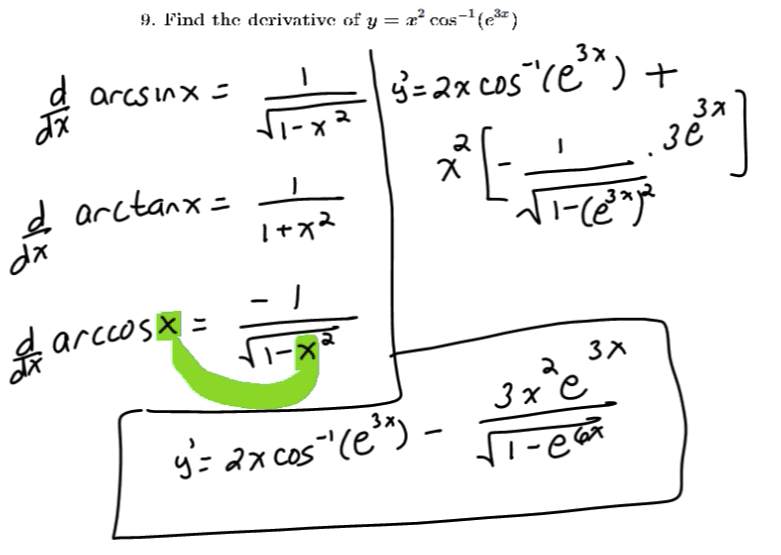
Finding the derivative of a function containing an inverse trigonometric function

Finding the derivative of a function containing an inverse trigonometric function

Finding the derivative of a function containing a logarithmic function

Finding the derivatives of functions containing logarithms

Finding the derivative of a function containing a logarithms

Finding the derivative using implicit differentiation

Finding the derivative using implicit differentiation

Finding the derivative using implicit differentiation

Finding the derivative using implicit differentiation

Finding the derivative using implicit differentiation

Solving for constants so that a piecewise function is differentiable everywhere

Using the derivative to find the total distance traveled by a particle

Finding a higher order derivative of a function

Using the Product and Chain Rule to find several derivatives

Using the Product, Quotient and Chain Rules to find several derivatives

Using the Quotient and Chain Rules to find several derivatives

Using the Product and Chain Rules to differentiate functions with logarithms

Differentiating functions with logarithmic and inverse trigonometric functions

Differentiating functions with inverse trigonometric functions

Finding the derivative of an implicit function

Finding the derivative of an implicit function

Using the chain rule to find a derivative
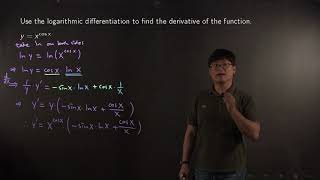
Using logarithmic differentiation to find the derivative of a function
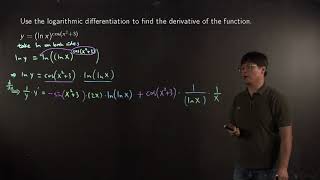
Using logarithmic differentiation to find the derivative of a function

Using the Product Rule to find the derivative of a product of functions

Using the Quotient Rule to find a derivative

Using the Chain Rule to find the derivative of a composition of functions

Finding the second derivative of an exponential functino

Finding the speed of an object given a vector function for its position
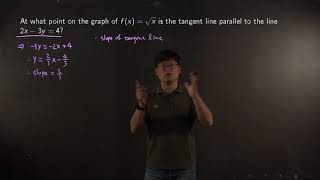
Finding the point when the tangent line to a function has a particular slope

Finding the linear approximation for a function

Finding the absolute maximum and absolute minimum values of a function on a closed interval

Finding the absolute maximum and absolute minimum values of a function on a closed interval

Finding the absolute maximum and absolute minimum values of a function on a closed interval

Sketching a curve given information about the function and its derivatives

Evaluating a limit using L'Hospital's Rule

Evaluating a limit using L'Hospital's Rule
Evaluating a limit using L'Hospital's Rule

Evaluating a limit using L'Hospital's Rule

Evaluating a limit with an indeterminate product using L'Hospital's Rule

Evaluating a limit with an indeterminant difference using L'Hospital's Rule
Evaluating a limit with an indeterminate power using L'Hospital's Rule

Evaluating a limit with an indeterminant power using L'Hospital's Rule
Using the first and second derivatives to sketch the graph of a function

Solving a word problem minimizing area

Solving a word problem maximizing area

Finding the point on a line closest to a point

Using the derivative to determine where a function is increasing and decreasing

Finding the absolute maximum and minimum values of a function on a closed interval

Finding the intervals where a function is increasing and decreasing and its local maximums and minimums

Finding where a function is increasing, decreasing, concave up and concave down and its local extrema and inflection points

Finding where a function is increasing, decreasing, concave up and concave down and its local extrema and inflection points

Finding where a function is increasing, decreasing, concave up and concave down and its local extrema and inflection points

Evaluating a limit using L'Hospital's Rule

Evaluating a limit with an indeterminant power using L'Hospital's Rule

Evaluating a limit with an indeterminant product using L'Hospital's Rule

Finding a number that satisfies the conclusion of the Mean Value Theorem for a function on an interval

Evaluating a limit with an indeterminant product using L'Hospital's Rule

Finding the antiderivative of a polynomial

Finding the antiderivative of a rational function

Finding the antiderivative of a function with secant and tangent

Finding the antiderivative of a function and using a function value to find the constant

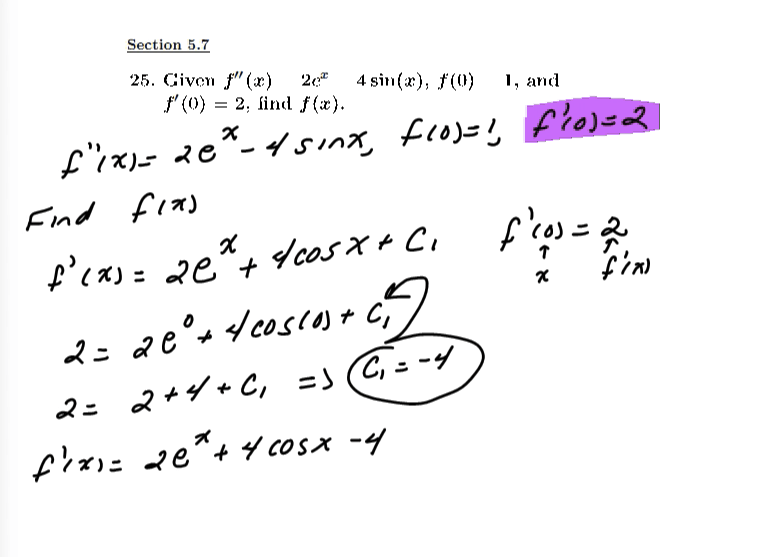
Antidifferentiating twice to find a function from its second d

Antidifferentiating twice to find a function from its second d

Determining the rate that the area of a triangle is increasing based on the rate an angle is increasing

Finding the value for a function that satisfies the Mean Value Theorem on an interval

Determining the properties of a function from the graph of its derivative

Using L'Hospital's Rule to solve a limit

Using L'Hospital's Rule to solve a limit with an indeterminant product

Using L'Hospital's Rule to solve a limit with an indeterminant difference

Using L'Hospital's Rule to solve a limit with an indeterminant power

Converting parametric equations into a Cartesian equation

Converting parametric equations into a Cartesian equation

Using L'Hospital's Rule to evaluate a limit representing a derivative at a point

Finding a derivative using the Product Rule

Finding a derivative using the Chain Rule multiple times

Finding a derivative using the Chain Rule and Product Rule

Finding a derivative using the Quotient Rule

Finding the derivative of an implicit function

Finding the derivative of an implicit function

Using logarithmic differentiation to find the derivative of a function

Find the integral representing the surface area of a rotated parametric curve

Finding the Taylor series of a function

Finding the Taylor series of a function

Determining if a series is absolutely convergent, conditionally convergent, or divergent.

Finding a power series representation for a function

Finding the area of a region bounded by two curves

Proving a certain parameterization gives the unit circle and showing vector equations of lines are parallel
Cartesian equations and parametric equations of curves
Derivatives of exponential functions and the exponential model
Optimization problems
Antiderivatives and physics applications
Evaluating limits of functions
Evaluating Limits of Functions
Continuity of Functions and the Intermediate Value Theorem

Proving a piecewise function and a polynomial are continuous
Limits at infinity and asymptotes, along with physics applications
Limits at infinity, asymptotes, and tangent lines
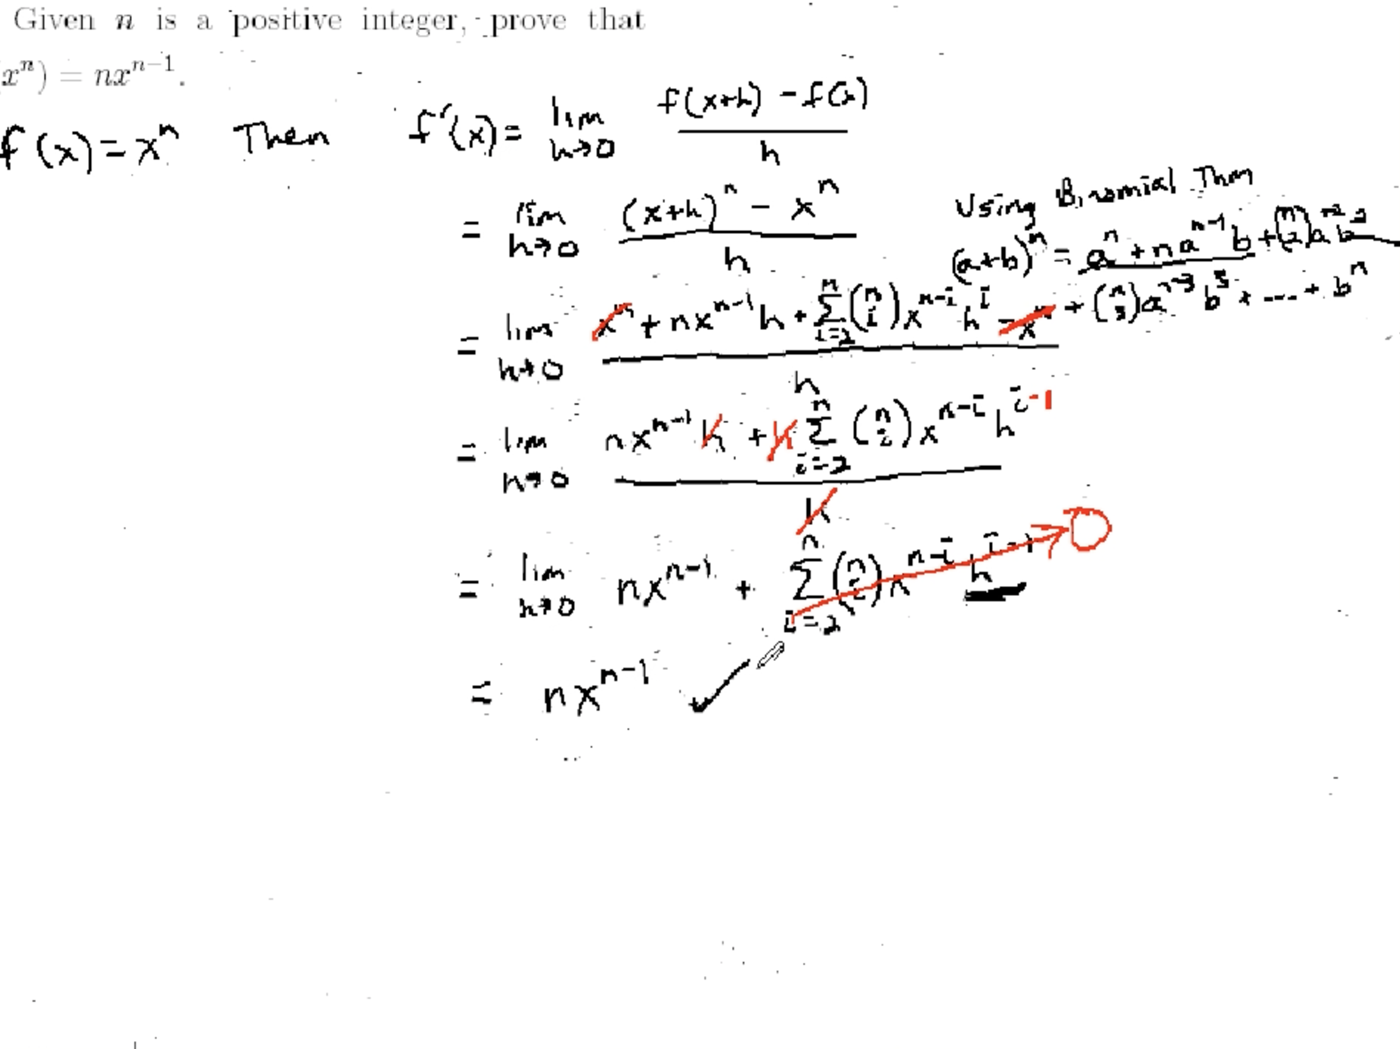
Using the limit definition to find a derivative and proving the power rule

Proving the Product Rule and the rule for the derivative of a difference of functions

Finding a formula for a higher order derivative and a formula for the second derivative of a product

Proving the derivatives of trigonometric functions and that sine is continuous
Using the Chain Rule to prove facts about derivatives
Using implicit differentiation to solve a problem and to prove the power rule for rational exponents
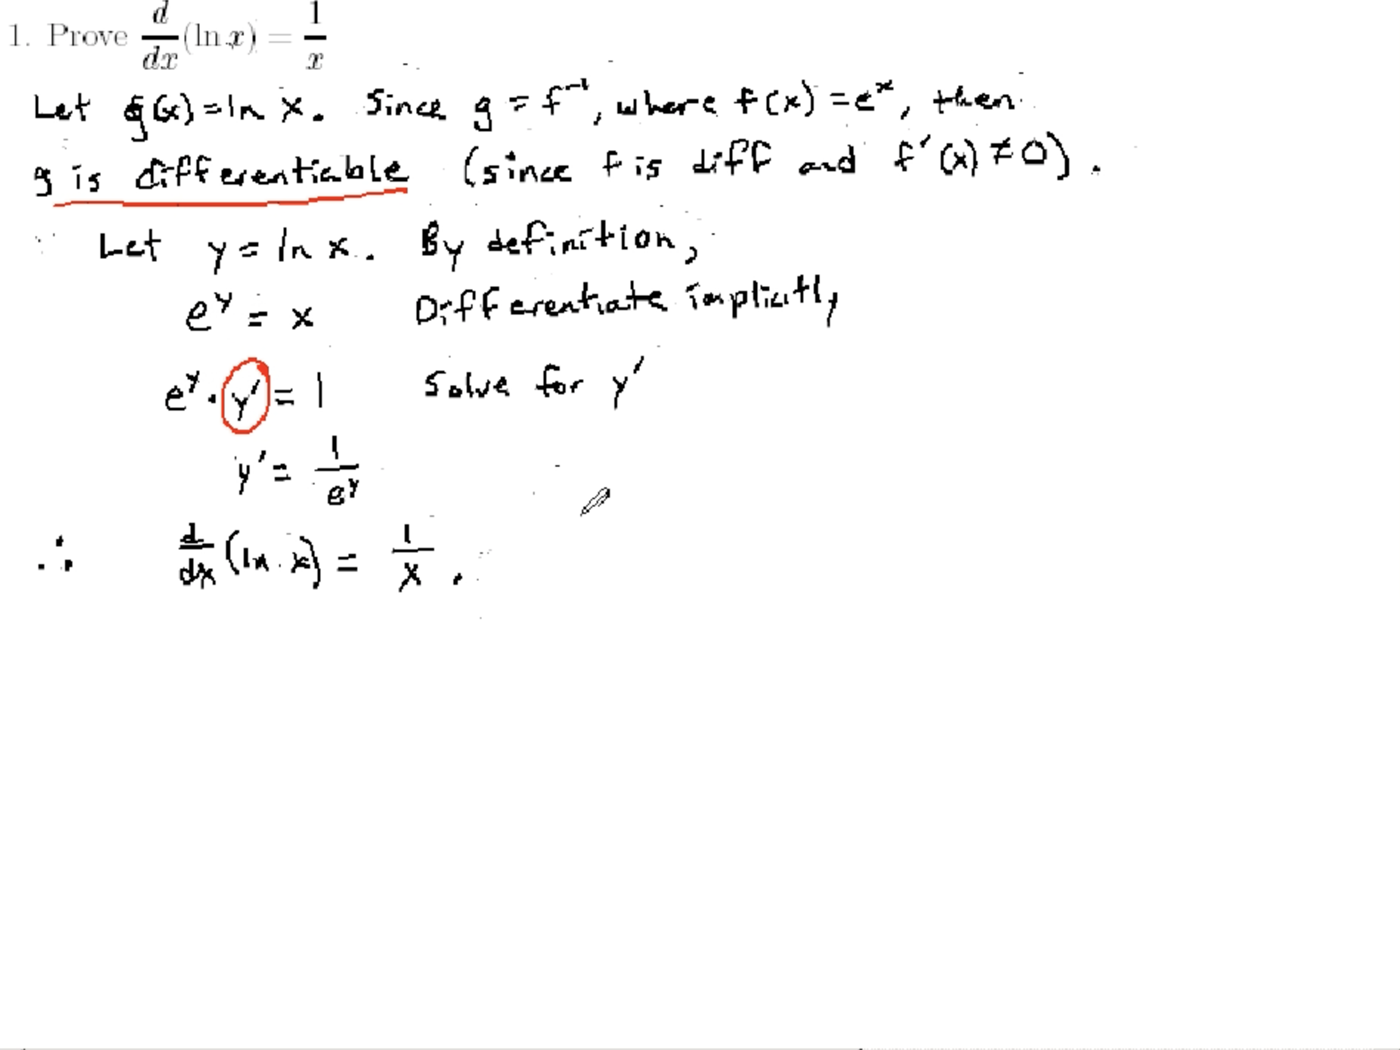
Proving the derivative of ln(x) and the power and product rules using logarithmic differentiation

Proving Fermat's Theorem and graphing local and absolute extrema
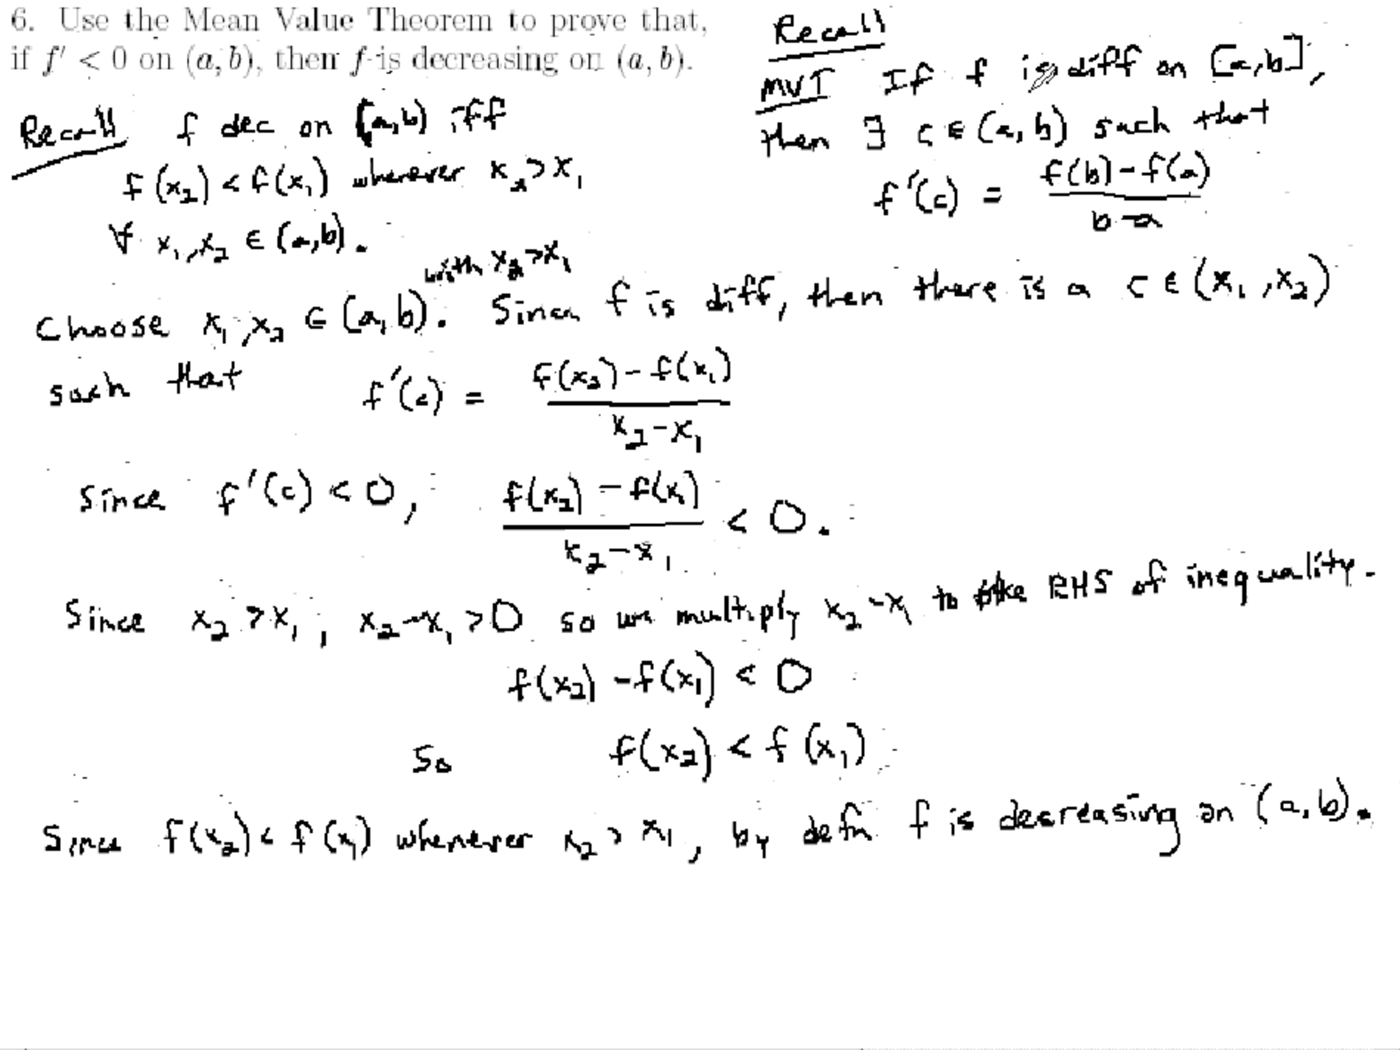
Using the Mean Value Theorem to prove facts about functions
Mean Value Theorem and properties of a graph
Mean Value Theorem and properties of a graph
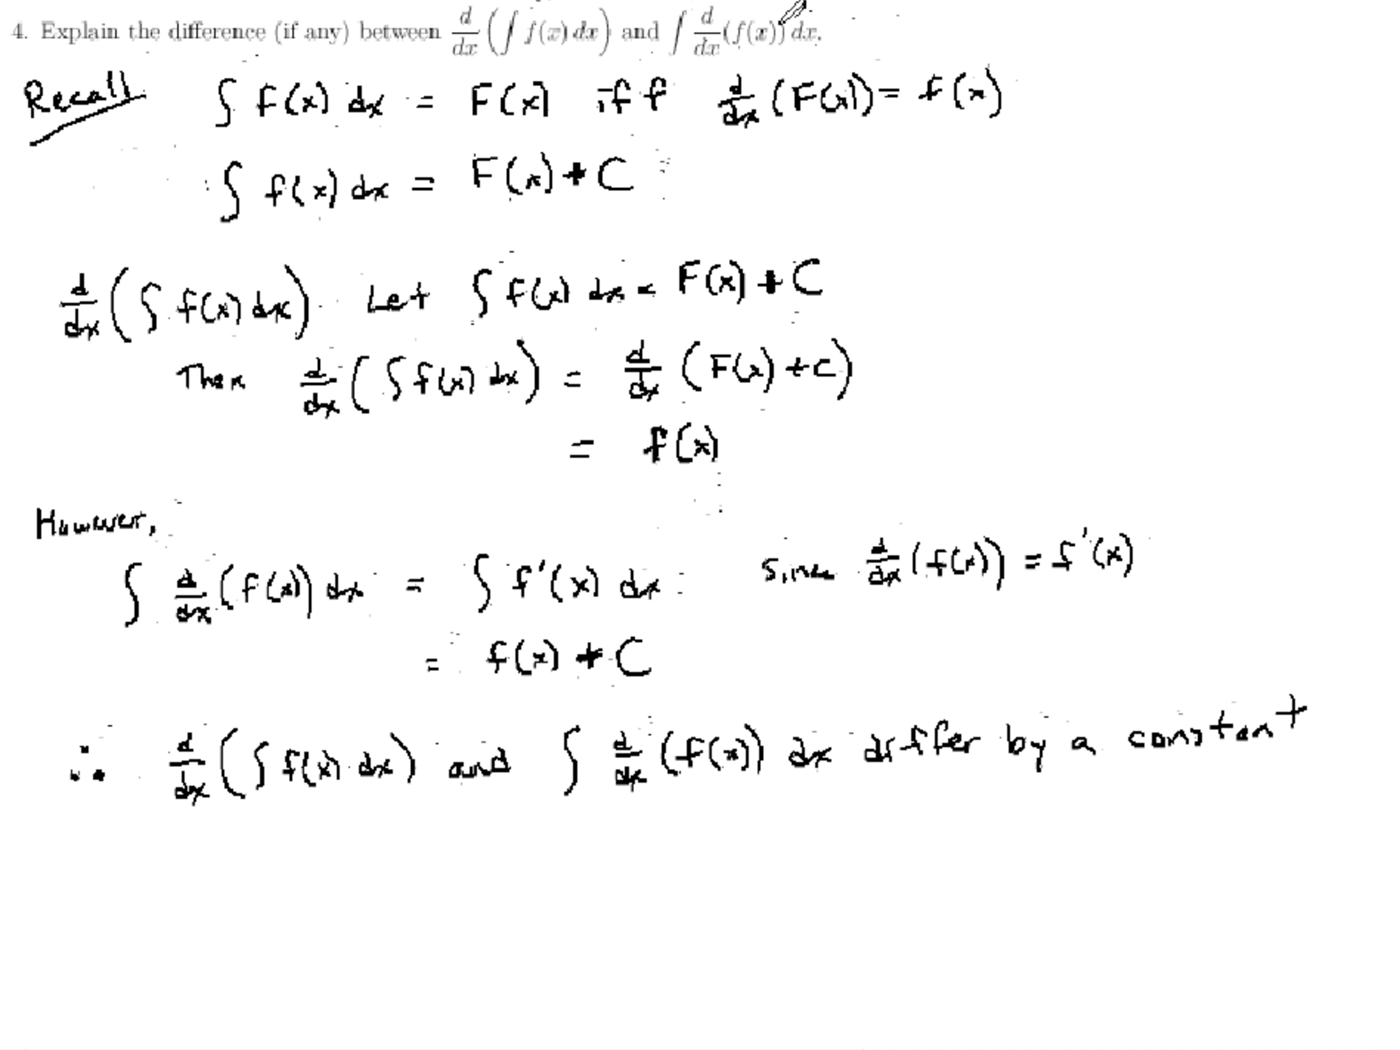
Proving facts about antiderivatives and a physics application
Using Reimann sums and the Fundamental Theorem of Calculus
Using Riemann sums and the Fundamental Theorem of Calculus

Explaining increasing, decreasing, and non monotonic for sequences

Proving the formula for integration by parts and a reduction formula

Showing how an equation in three dimensional space represents a plane
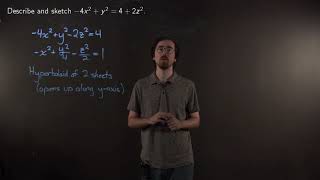
Identifying the equation of a hyperboloid and sketching its graph

Identifying the equation of a cone in three dimensions and sketching its graph

Finding the angle of intersection for two three-dimensional vector functions

Finding the length of a three-dimensional curve

Finding the curvature of a three-dimensional vector function

Finding and sketching the domain of a function of two variables

Finding and sketching the domain of a function of two variables

Sketching the graph of a function of two variables

Sketching the graph of a function of two variables

Sketching the level curves of a function of two variables

Sketching the level curves of a function of two variables

Describing the level surfaces of a function of three variables

Finding the tangent plane and the normal line for a surface

Finding the absolute maximum and minimum values of a function of two variables on a rectangle

Finding the absolute maximum and minimum values of a function of two variables on a triangular region

Evaluating a double integral over a given region

Evaluating a double integral over a given region

Evaluating a double integral and sketching the region of integration

Changing the order of integration for a double integral

Evaluating a double integral by reversing the order of integration

Setting up double integrals of Type I and II to give the volume of a solid under a surface

Evaluating a double integral over a circular region by changing to polar coordinates

Evaluating a double integral by changing to polar coordinates

Evaluating a double integral by changing to polar coordinates

Converting a double integral to a double integral in polar coordinates

Writing an iterated integral in polar coordinates that gives the volume of the solid that lies below a paraboloid

Writing an iterated integral in polar coordinates that gives the volume of the solid bounded by a cone

Writing an a triple integral over a given solid as an iterated integral

Evaluating a triple integral over a solid bounded by given surfaces

Writing an iterated integral that gives the volume of a solid

Evaluating a triple integral over a solid bounded by elliptic paraboloids

Writing a triple integral as an iterated integral in cylindrical coordinates

Converting an iterated triple integral into cylindrical and spherical coordinates

Using an iterated integral in spherical coordinates to find the volume of a solid

Evaluating a triple integral for a given solid by writing an iterated integral in spherical coordinates

Using the Fundamental Theorem of Line Integrals to evaluate a line integral of a vector field

Using a double integral to find the surface area of a parametric surface

Evaluating a surface integral of a vector field

Using Stokes' Theorem to express a surface integral of the curl of a vector field as a single integral

Explaining how to find the derivative and integral of matrix and vector functions

Finding the limit of a sequence

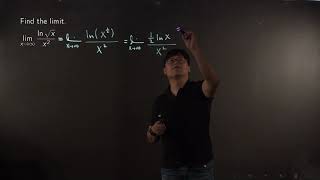
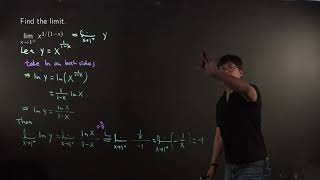
Finding the limit of a sequence using logarithm properties

Finding the limit of a sequence
Explaining increasing, decreasing, and non monotonic for sequences

Determining if a sequence is increasing, decreasing, or non monotonic

Determining if a sequence converges or diverges

Introducing functions of several variables and level curves

Evaluating and then finding and sketching the domain of a function of two variables

Finding and sketching the domain of a function of two variables

Sketching the level curves for a function of two variables

Sketching the level curves for a function of two variables

Sketching the level curves for a function of two variables

Explaining the Chain Rule for multivariable functions

Using the Chain Rule for multivariable functions to find the rate a volume is changing
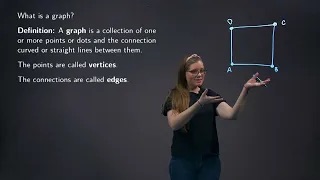
Explaining that a graph is a collection of vertices and edges

Drawing a graph to depict a bus route

Counting the vertices and edges from a graph

Identifying the adjacent vertices in a graph

Finding two different paths between vertices in a graph

Determining if a list of vertices in a graph is a path, circuit, Euler path, Euler circuit, or none of the above

Determining if a list of vertices in a graph is a path, a circuits, an Euler path, an Euler circuit, or none of the above

Determining if a list of vertices in a graph is a path, a circuits, an Euler path, an Euler circuit, or none of the above

Determining if a list of vertices in a graph is a path, a circuits, an Euler path, an Euler circuit, or none of the above

Determining if a list of vertices in a graph is a path, a circuits, an Euler path, an Euler circuit, or none of the above

Determining if a list of vertices in a graph is a path, a circuits, an Euler path, an Euler circuit, or none of the above

Explaining Euler's Theorem on when a graph has an Euler path or Euler circuit

Finding the valence of each vertex in a graph

Explaining Hamiltonian Circuits and paths, the Method of Trees to find them, and the number of Hamiltonian circuits for complete graphs

Determining if a graph has a Hamiltonian path, Hamiltonian Circuit, or neither

Determining if a graph has a Hamiltonian path, Hamiltonian Circuit, or neither

Determining if a graph has a Hamiltonian path, Hamiltonian Circuit, or neither

Determining if a graph has a Hamiltonian path, Hamiltonian Circuit, or neither

Using the method of trees to find all Hamiltonian circuits of a graph starting at a given vertex

Determining if a graph is a complete graph

Determining if a graph is a complete graph

Determining if a graph is a complete graph

Determining if a graph is a complete graph

Finding two spanning trees for a graph

Finding the nth Taylor polynomial of the natural log function centered at 1

Using a Taylor polynomial to approximate the value of a function and estimating the error
Introducing functions of several variables and level curves
Explaining the Chain Rule for multivariable functions
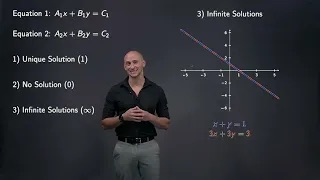
Explaining the format and possible solutions for a system of two linear equations

Explanation of graphs for data and which are appropriate for categorical or numerical data

Solving a system of linear equations and giving a geometric interpretation of the solution
Solving a system of two linear equations in two unknowns by graphing

Determining if a graph represents a function and finding the domain and range

Determining if a series converges or diverges

Using the Alternating Series Test to determine if a series converges or diverges

Creating symbolic expression in Python and then factoring, expanding, and simplifying the expressions

Solving equations symbolically in Python and interpreting the results

Defining variables in Python and using the variables in equations

Performing basic numerical calculations in Python

Plotting an expression in Python and finding a numerical approximation for the solution

An introduction to installing and getting started with Python

Using Python to simplify a difference quotient and find a derivative using the limit definition

Solving definite and indefinite integrals in Python

Using Python to find the absolute maximum and minimum of a function on a closed interval

Using Python to approximate a definite integral using left endpoint Riemann sums

Using Python to identify the region between curves and then evaluate the area of the region

Using Python to calculate the amount of work done in moving a spring using Hooke's Law

Using Python to calculate the work done in pumping the liquid from a tank whose ends are semicircles

Using Python to find the radius and interval of convergence of a power series with the Ratio Test

Video 29 in a series of Python instructional videos

Finding the volume of a solid of revolution in Python

Using for loops in Python to generate a recursively defined sequence

Using Python to calculate the partial sums of a series to estimate the value of the series

Using Python to numerically, graphically, and analytically find the limit of a sequence

Discussing how to write the equation of a line through two given points
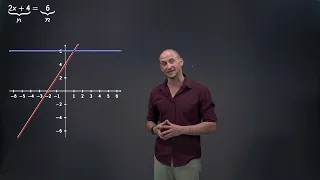
Solving a linear equation algebraically and showing how this relates to the graph
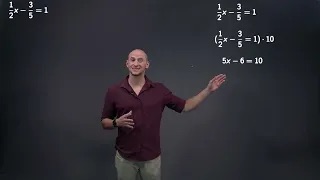
Solving a linear equation algebraically

Solving a linear equation algebraically and showing how this relates to the graph
Explaining the format and possible solutions for a system of two linear equations
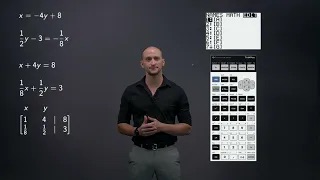
Solving a system of two linear equations using a TI-84 calculator
Solving a system of two linear equations using a TI-84 calculator
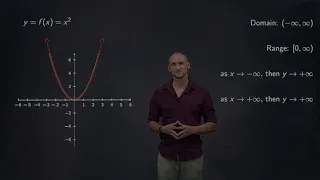
Explaining the graph and properties for the parent function of quadratics

Explaining when a quadratic equation does not have a real solution
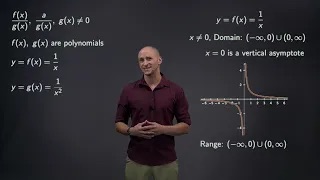
Discussing parent functions of rational functions and their properties
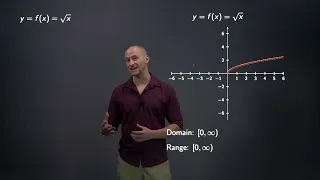
Explaining the general properties of even and odd root functions
Solving equations with even roots and checking the solutions
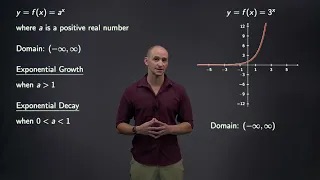
Properties of exponential growth and decay functions
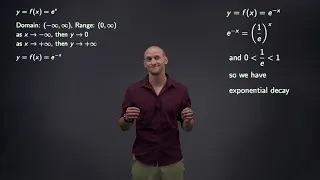
Properties of the exponential function with base e
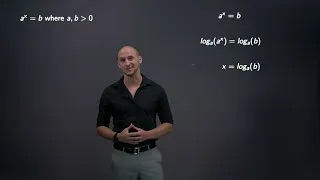
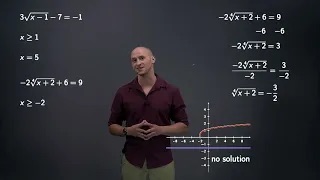
Explaining how to solve equations with power and exponential terms
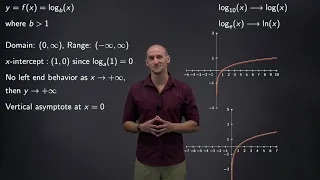
Explaining the basic properties of logarithmic functions

Using double integrals to calculate the weight of a plate given its density and size

Evaluating iterated integrals over the same region but with different orders of integration

Writing and then solving an iterated integral for a given region
Explaining the format and possible solutions for a system of two linear equations
Properties of exponential growth and decay functions
Properties of the exponential function with base e
Explaining the basic properties of logarithmic functions
Explaining the formulas for the derivatives of exponential functions
Introducing functions of several variables and level curves
Review of vector functions and parametric equations
Review of limits, continuity, and the Intermediate Value Theorem