
WIR 20B M152 V78
Evaluating an indefinite integral using a power series
Problem: Plot \(f(x)=\arctan(x)\) and the 3rd, 5th, and 10th partial sum of its powers series
\[\sum_{n=0}^\infty \frac{(-1)^n x^{2n+1}}{ 2n+1}\]
Evaluating an indefinite integral using a power series

Review of power series properties and writing functions as power series

Finding power series representations for functions and the radius and interval of convergence of the power series

Finding a power series representation for a function

Finding a power series representation for a function
Review of power series properties and writing functions as power series
Finding power series representations for functions and the radius and interval of convergence of the power series

Using Python to calculate the partial sums of a series to estimate the value of the series

Using Python to find the radius and interval of convergence of a power series with the Ratio Test

Evaluating arctangent

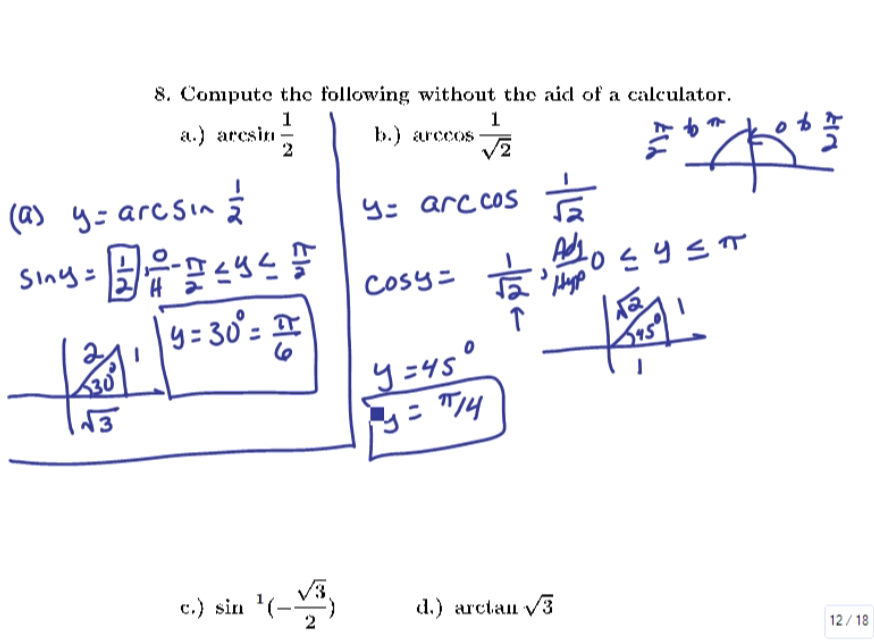
Evaluating compositions with inverse trigonometric functions

Evaluating compositions with inverse trigonometric functions

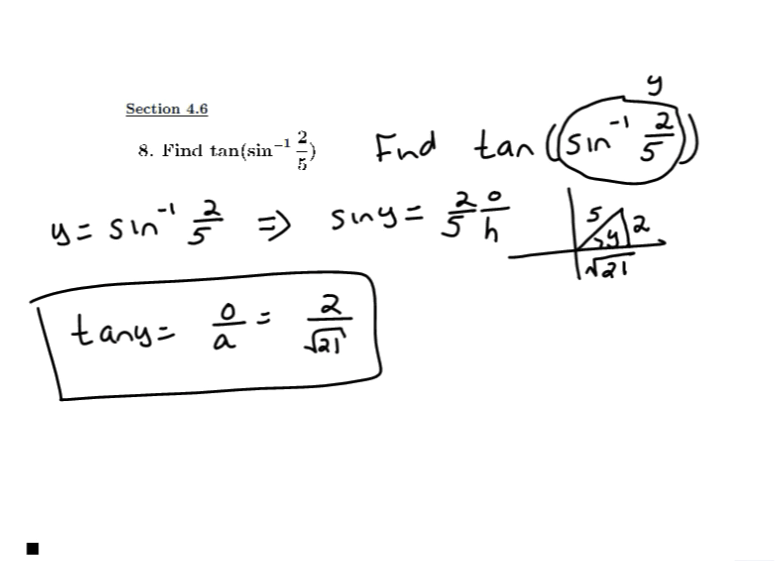
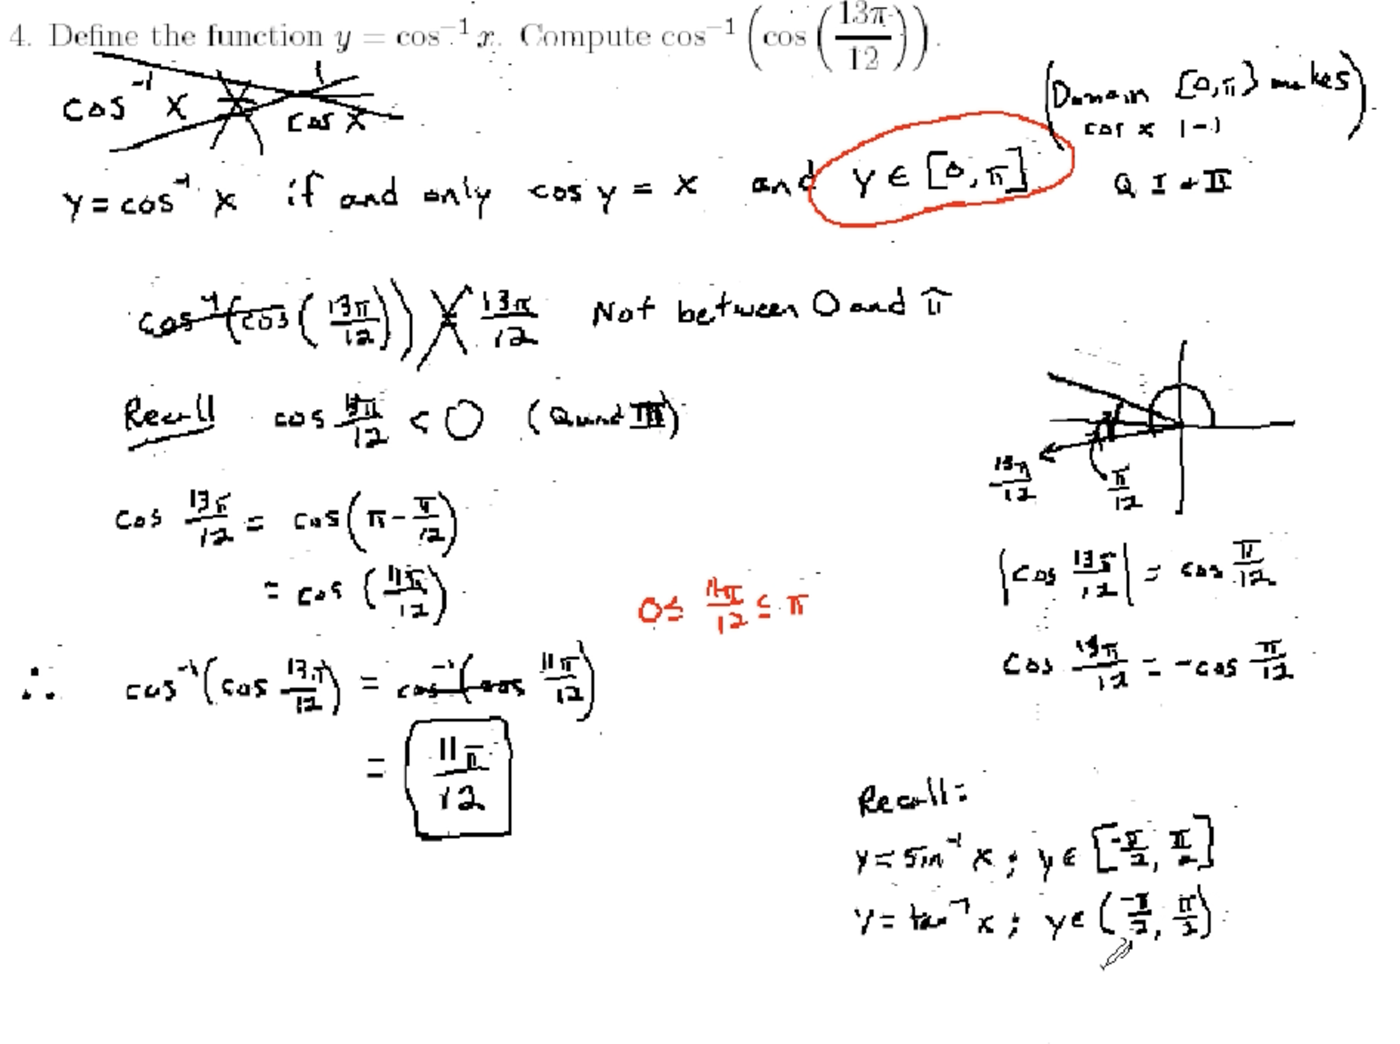
Evaluating a composition of trigonometric and inverse trigonometric functions
Review of limits and derivatives of inverse trigonometric functions
Review of limits and derivatives of inverse trigonometric functions
Properties and derivatives of inverse trigonometric functions

Properties and derivatives of inverse trigonometric functions
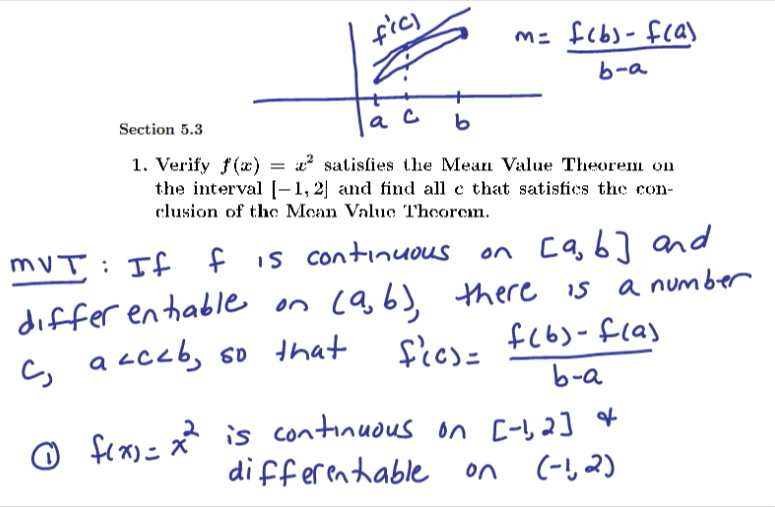
Mean Value Theorem and properties of a graph
Mean Value Theorem and properties of a graph

Using vectors and trigonometry to find the true speed and direction of a boat

Simplifying expressions containing trigonometric and inverse trigonometric functions

Using vectors to find the magnitude and direction of a resultant force

Evaluating compositions of trigonometric and inverse trigonometric functions

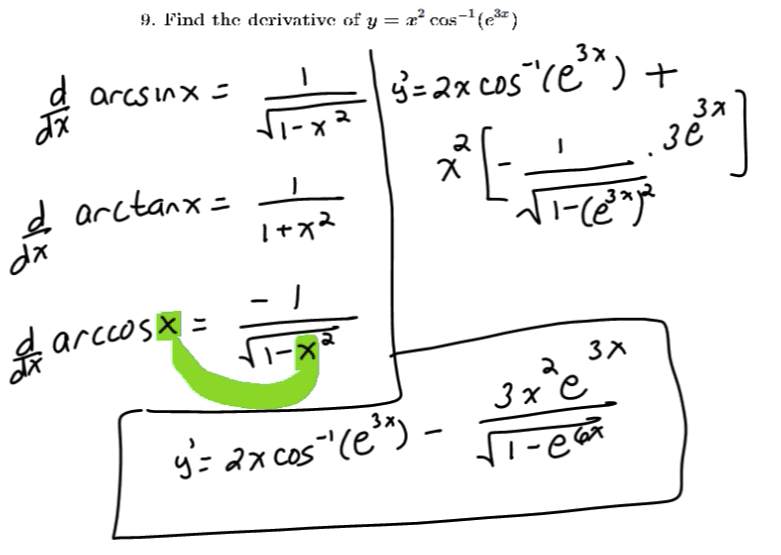
Finding the derivative of a function containing an inverse trigonometric function

Finding the derivative of a function containing an inverse trigonometric function

Differentiating functions with inverse trigonometric functions

Evaluating an indefinite integral with powers of x and using arctangent
Review of sequences and finding the sum of a series

Review of finding the radius and interval of convergence for a power series

Review of Taylor and Maclaurin Series and their properties

Review of Taylor Polynomials and Taylor's Inequality

Finding the Taylor polynomial of a function

Finding a Taylor Polynomial for a function

Finding the interval and radius of convergence for a power series

Finding the interval and radius of convergence for a power series

Finding the interval and radius of convergence for a power series

Determining the radius and interval of convergence for a power series

Solving a definite integral with arctangent using integration by parts

Integrating a rational function using u-substitution

Using u-substitution for an indefinite integral that has the derivative of arctangent

Evaluating an integral using integration by parts
Review of limits and derivatives of inverse trigonometric functions
Properties and derivatives of inverse trigonometric functions
Properties of inverse trig functions and the derivative of arctangent
Properties and derivatives of inverse trigonometric functions
Mean Value Theorem and properties of a graph
Mean Value Theorem and properties of a graph
Review of sequences and finding the sum of a series
Review of Taylor and Maclaurin Series and their properties
Review of Taylor Polynomials and Taylor's Inequality
Review of finding the radius and interval of convergence for a power series

Reviewing Taylor and Maclaurin Series and Taylor's Inequality
Finding a Taylor Polynomial for a function
Determining the radius and interval of convergence for a power series

Covering Radius and Interval of Convergence of Power Series
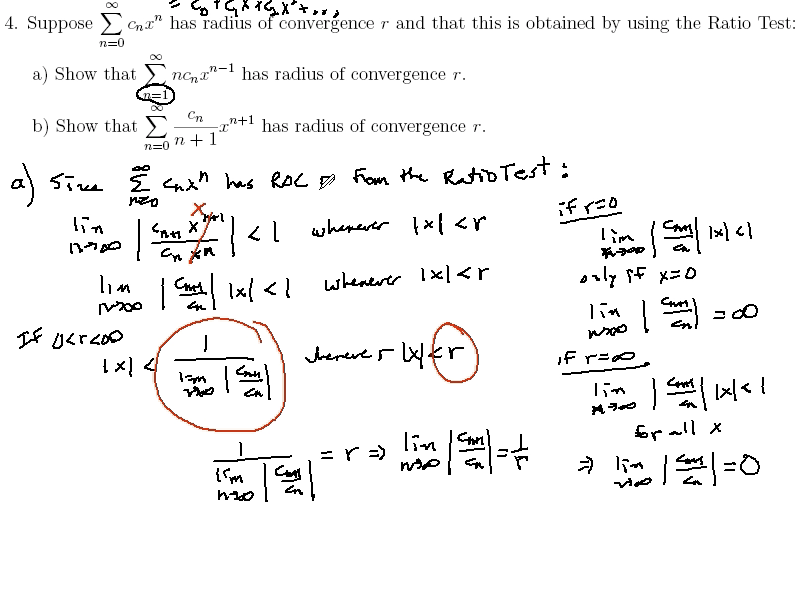
Examples about the derivative and integral of a power series

Integrating using a trigonometric substitution

Determining the radius of convergence of a power series

Finding a power series solution to a differential equation

Finding a power series solution to a differential equation

Finding a power series solution to an initial value problem

Finding the value of the second and third derivative of a solution at the given point

Showing how the exponential function is the solution to an initial value problem

Using power series to define a matrix exponential function to use in solving differential equations with matrices

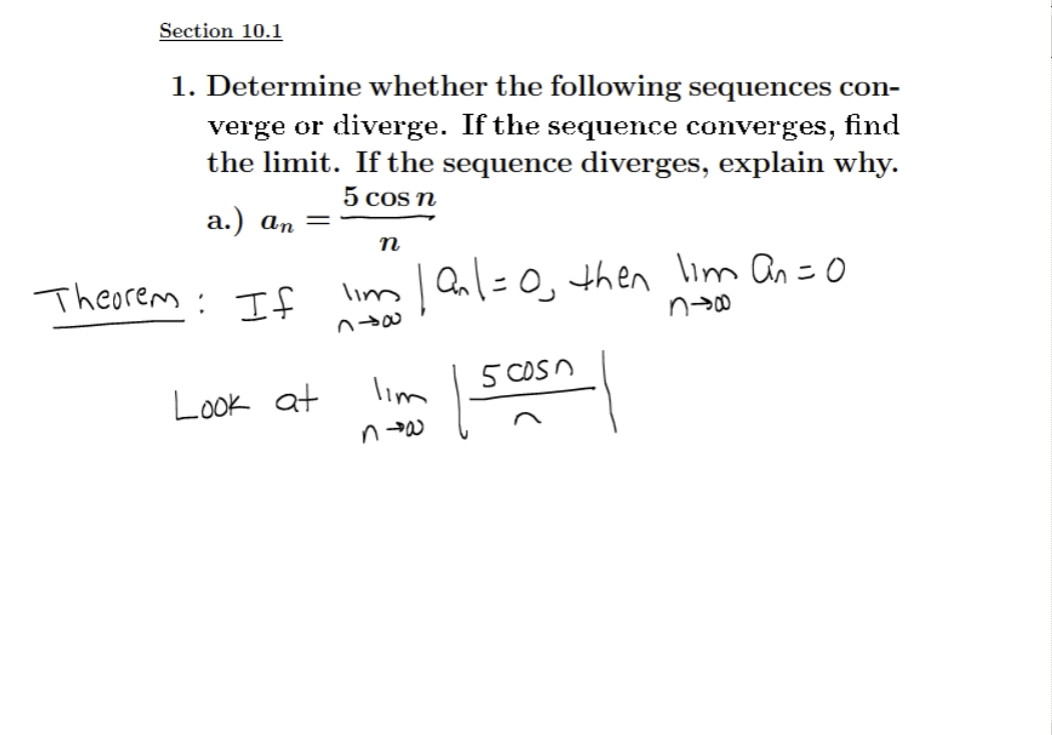
Determining if a sequence converges or diverges

Determining if a sequence is increasing, decreasing, or not monotonic and if it is bounded

Solving a system of first-order linear differential equations using a matrix exponential function

Finding the nth Taylor polynomial of the natural log function centered at 1

Using a Taylor polynomial to approximate the value of a function and estimating the error

Finding properties of a series given a formula for the partial sums of the series

Solving for a variable to make a geometric series converge

Creating symbolic expression in Python and then factoring, expanding, and simplifying the expressions

Solving equations symbolically in Python and interpreting the results

Defining variables in Python and using the variables in equations

Plotting an expression in Python and finding a numerical approximation for the solution

Graphing a piecewise function using Python

An introduction to installing and getting started with Python

Performing basic numerical calculations in Python

Using Python to find the tangent line to a parametric equation and plot the two graphs

Using Python to numerically estimate a limit, graphically estimate a limit, and find the exact limit

Using Python's list comprehension tool to find several higher order derivatives of a function at once

Using Python to simplify a difference quotient and find a derivative using the limit definition

Using Python to plot an implicit curve and find a tangent line using implicit differentiation

Solving a multistep word problem in Python and graphing the resulting function

Using Python to plot a parametrized curve and its tangent line at a point

Solving definite and indefinite integrals in Python

Using Python to find the absolute maximum and minimum of a function on a closed interval

Using Python to find the equation of the tangent line to a curve and graphing the result

Finding derivatives in Python and solving for the rate of change of a force

Finding when the tangent line to a function is horizontal in Python

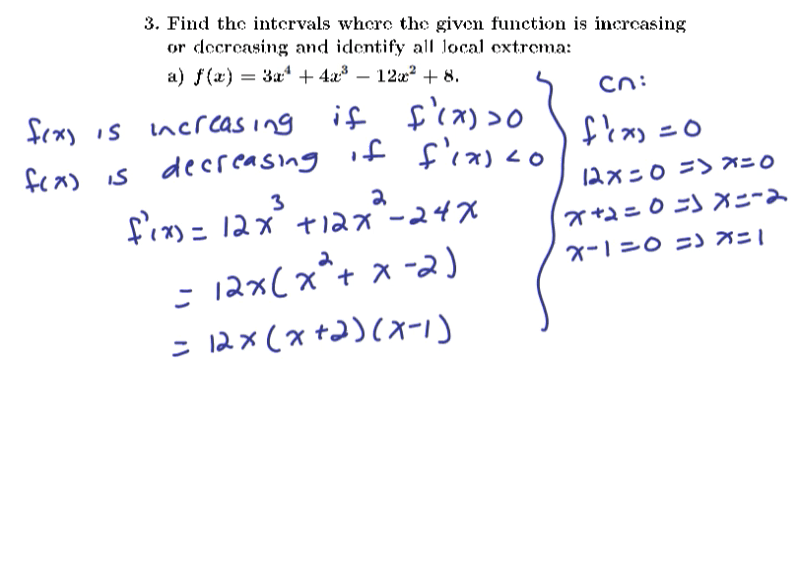
Using Python to find the intervals where a function is increasing or decreasing

Using Python to approximate a definite integral using left endpoint Riemann sums

Using Python to identify the region between curves and then evaluate the area of the region

Using Python to calculate the amount of work done in moving a spring using Hooke's Law

Using Python to calculate the work done in pumping the liquid from a tank whose ends are semicircles

Using for loops in Python to generate a recursively defined sequence

Finding the volume of a solid of revolution in Python

Using Python to numerically, graphically, and analytically find the limit of a sequence
Review of limits and derivatives of inverse trigonometric functions