
Transformations of Trig Graphs Exercise 3
Writing the sine and cosine functions for a given graph
Problem: Graph a period of \(f(x)=-4\cos\left(\dfrac{\pi}{3}(x+2)\right)-1.\)


Writing the sine and cosine functions for a given graph

Determining the properties of a cosine function and graphing it

Writing the equation for a cossine function with certain characteristics

Writing the equation for a cosine function to match a given graph

Graphing a period of a transformed sine function

Writing a cosine function for a given graph

Writing the equation for a sine function to match a given graph

Determining the properties of a sine function and graphing it

Writing the equation for a sine function with certain characteristics

Finding the properties of a transformed tangent function and graphing it

Sketching one period of a transformed sine graph

Sketching one period of a cosine function with transformations

Finding the amplitude, period, phase shift, and vertical shift for a given sine function

Explaining the trigonometric ratios of right triangles for sine, cosine, and tangent

Using trig to find an angle in a right triangle with two given sides

Finding the values of trig functions with the unit circle

Finding the exact values of cosine and cotangent for given angles using the unit circle

Finding the angle where secant has a given value and tangent is positive

Using the unit circle to sketch the graph of the cosine function

Using the unit circle to sketch the graph of the tangent function

Graphing the reciprocal trig functions cosecant, secant, and cotangent

Using the sum identities of sine and cosine to derive the double angle identities

Using the difference identities of sine and cosine to derive the cofunction identities

Using a Double Angle Identity to find the exact value of an expression with sine and cosine

Using the Half-Angle Identities to find the exact values of sine, cosine, and tangent

Using the Sum and Difference Identities to find the exact value of cosine

Solving a trigonometric equation with sine and cosine by factoring

Solving a trig equation with sine and cosine using trig identities

Solving a trig equation with cosine using trig identities

Solving a trig equation with sine and cosine using aPythagorean Identity

Solving a limit example with a trigonometric functions

Solving a limit example with a trigonometric function

Evaluating a trigonometric limit using trigonometric identities

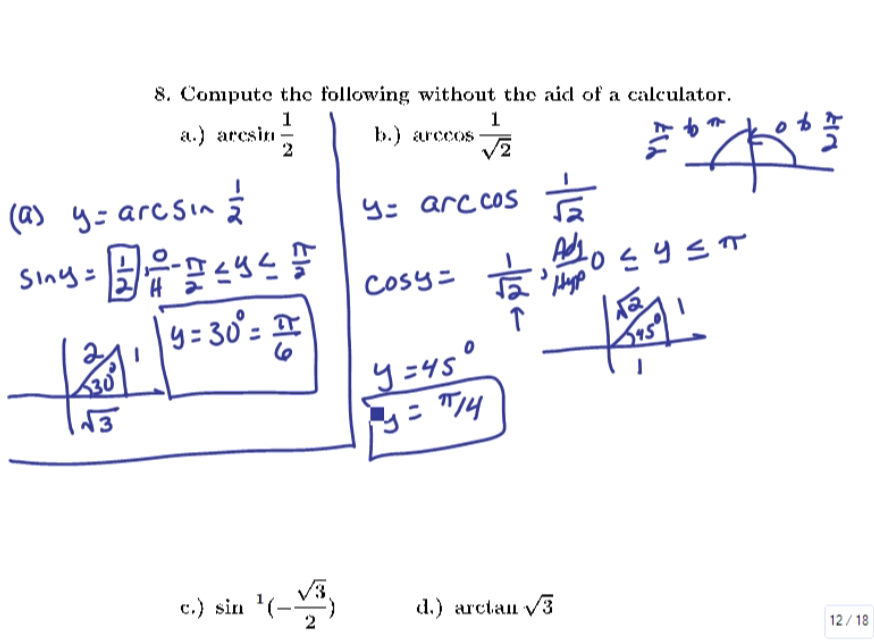
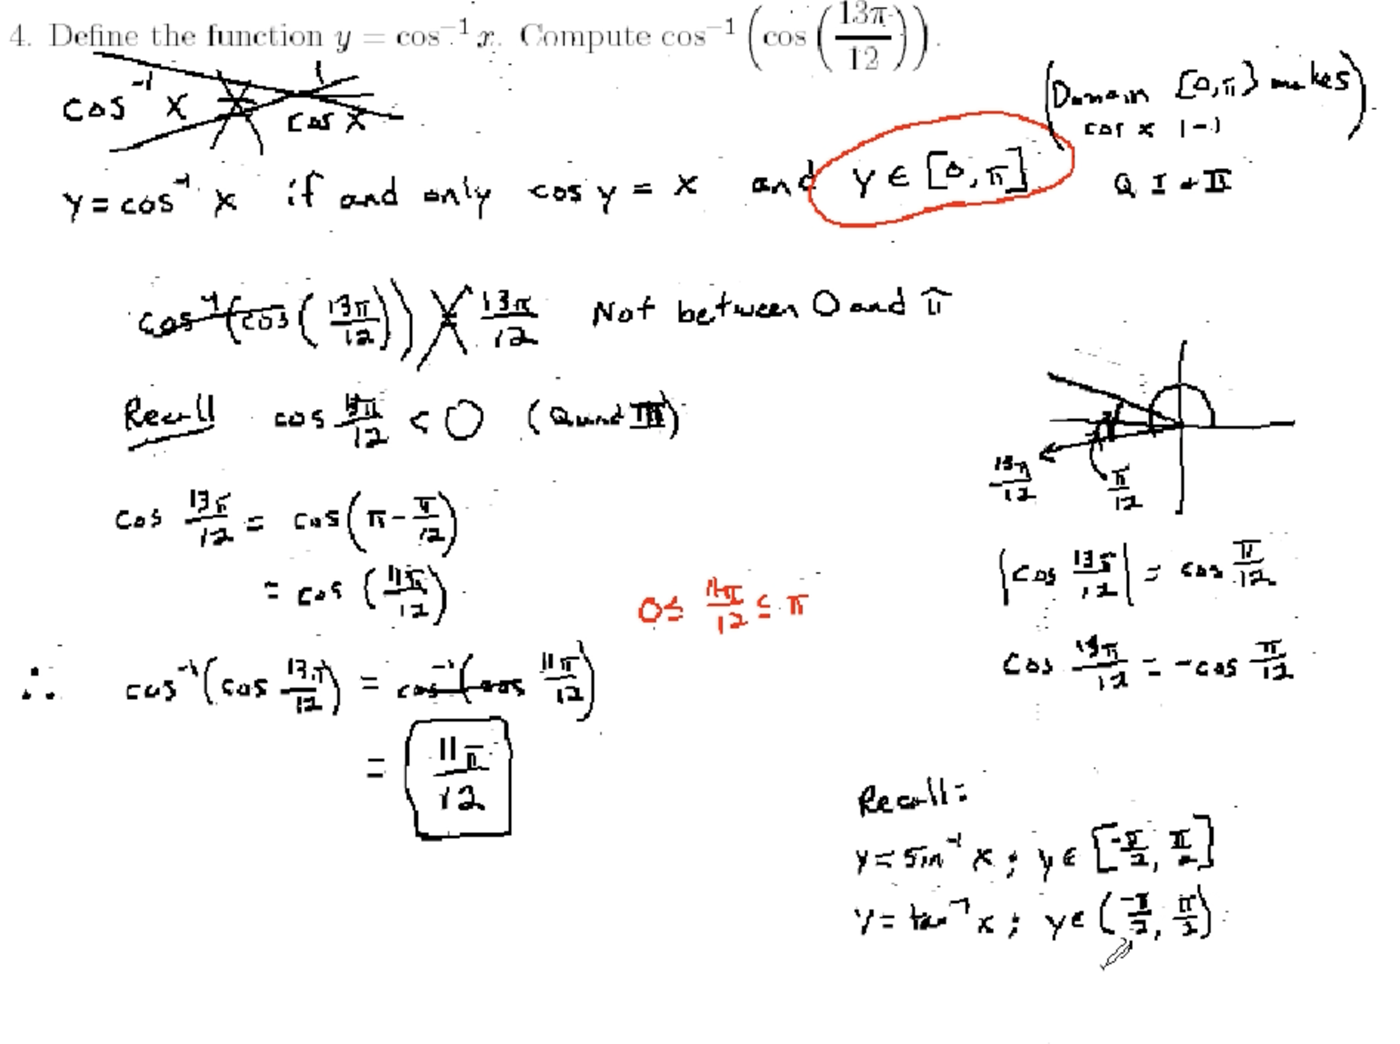
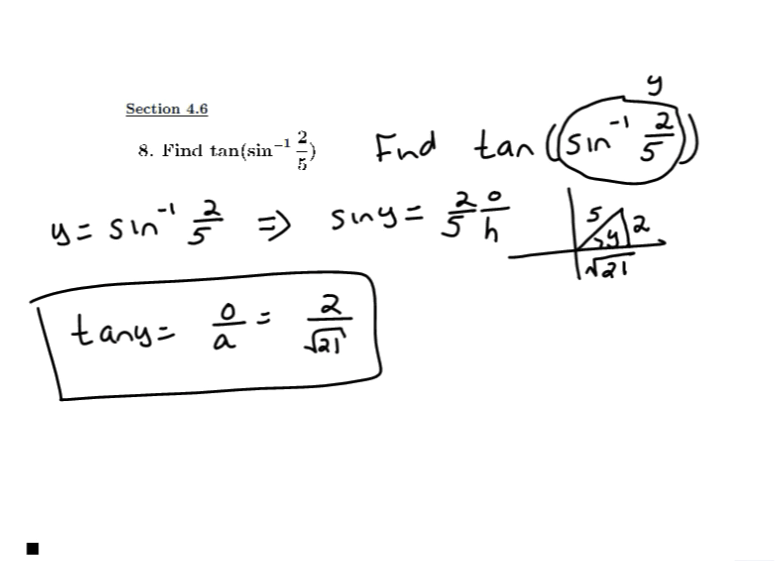
Evaluating compositions with inverse trigonometric functions

Evaluating compositions with inverse trigonometric functions

Evaluating a composition of trigonometric and inverse trigonometric functions

Verifying a trigonometric identity

Verifying a trigonometric identity

Solving a trigonometric equation

Solving a trigonometric equation by factoring

Solving a trigonometric equation

Using a double angle formula to solve a trigonometric equation

Using a double angle formula to solve a trigonometric equation

Solving a trigonometric equation

Using double angle formulas to evaluate trigonometric functions

Using a sum formula to evaluate a trigonometric expression

Using a sum formula to rewrite a trigonometric expression

Using the Law of Cosines to solve a triangle
Properties and derivatives of inverse trigonometric functions

Properties and derivatives of inverse trigonometric functions

Evaluating compositions of trigonometric and inverse trigonometric functions

Finding a Cartesian equation for a parametric curve

Using vectors to find the magnitude and direction of a resultant force

Converting parametric equations into a Cartesian equation

Converting parametric equations into a Cartesian equation and graphing

Using trigonometric identities to integrate powers of sine and cosine

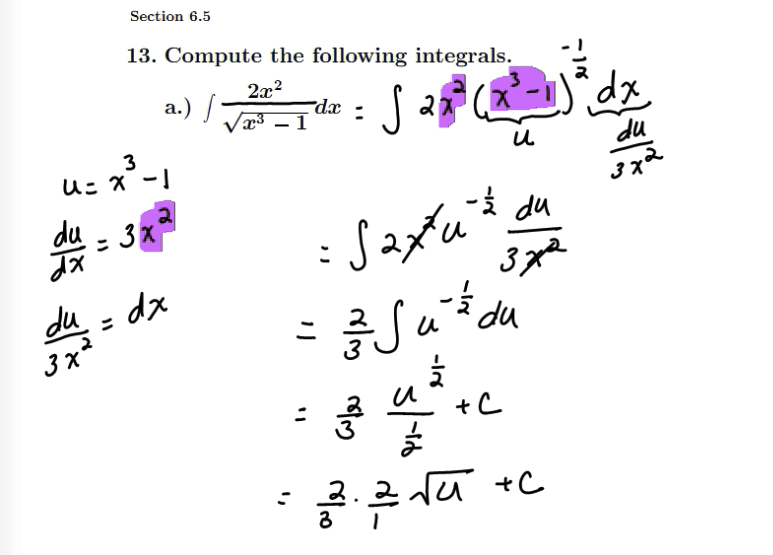
Integrating a function with sine using u-substitution
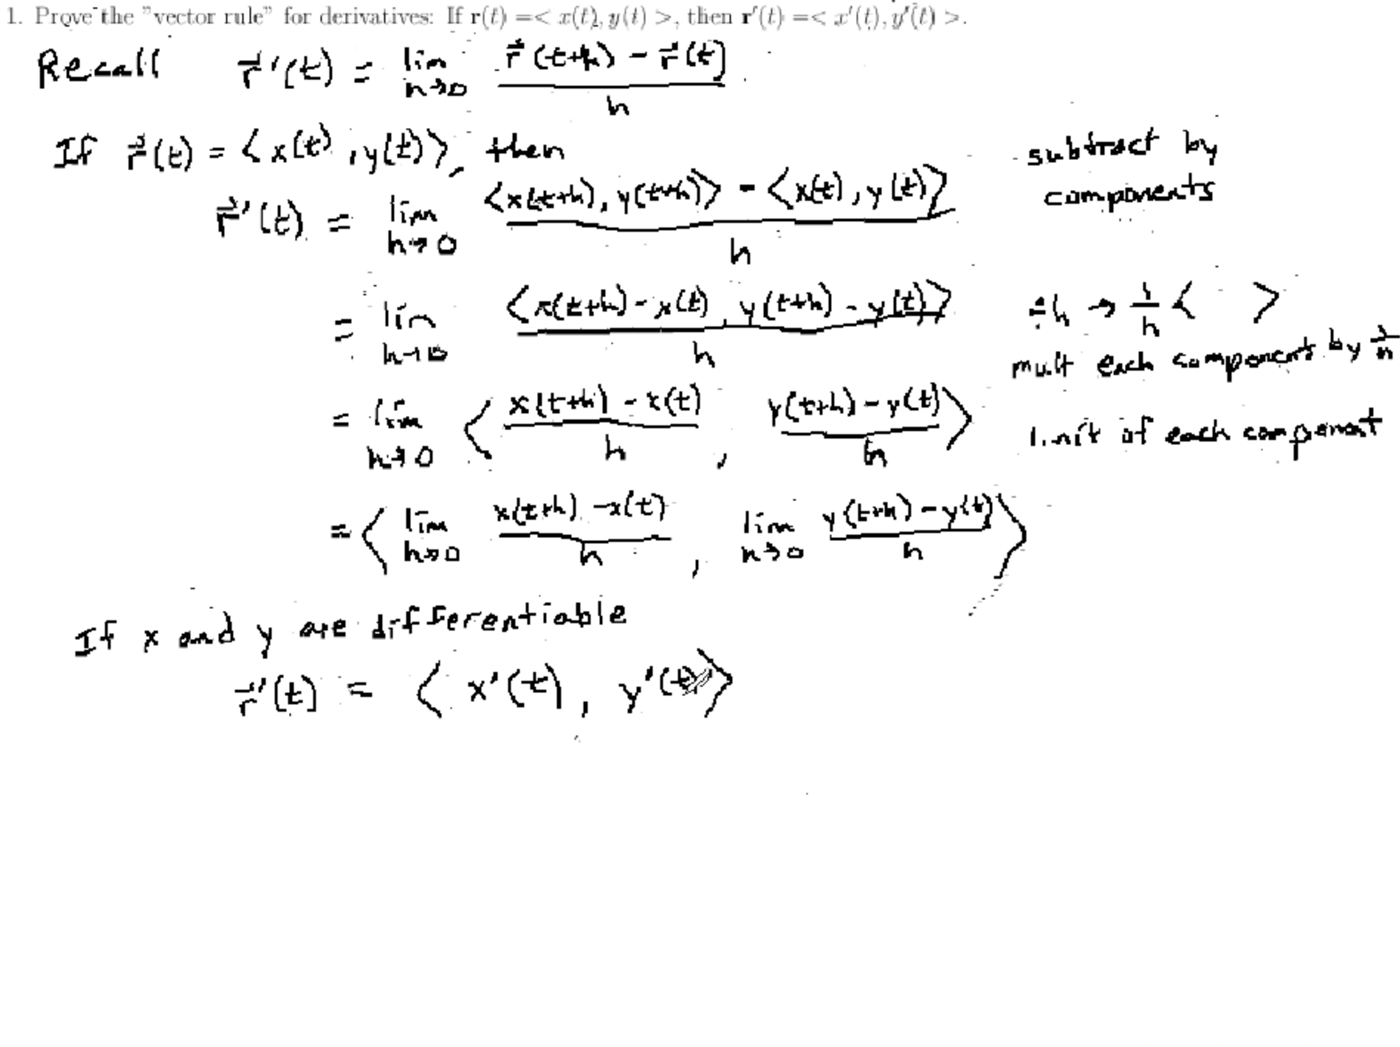
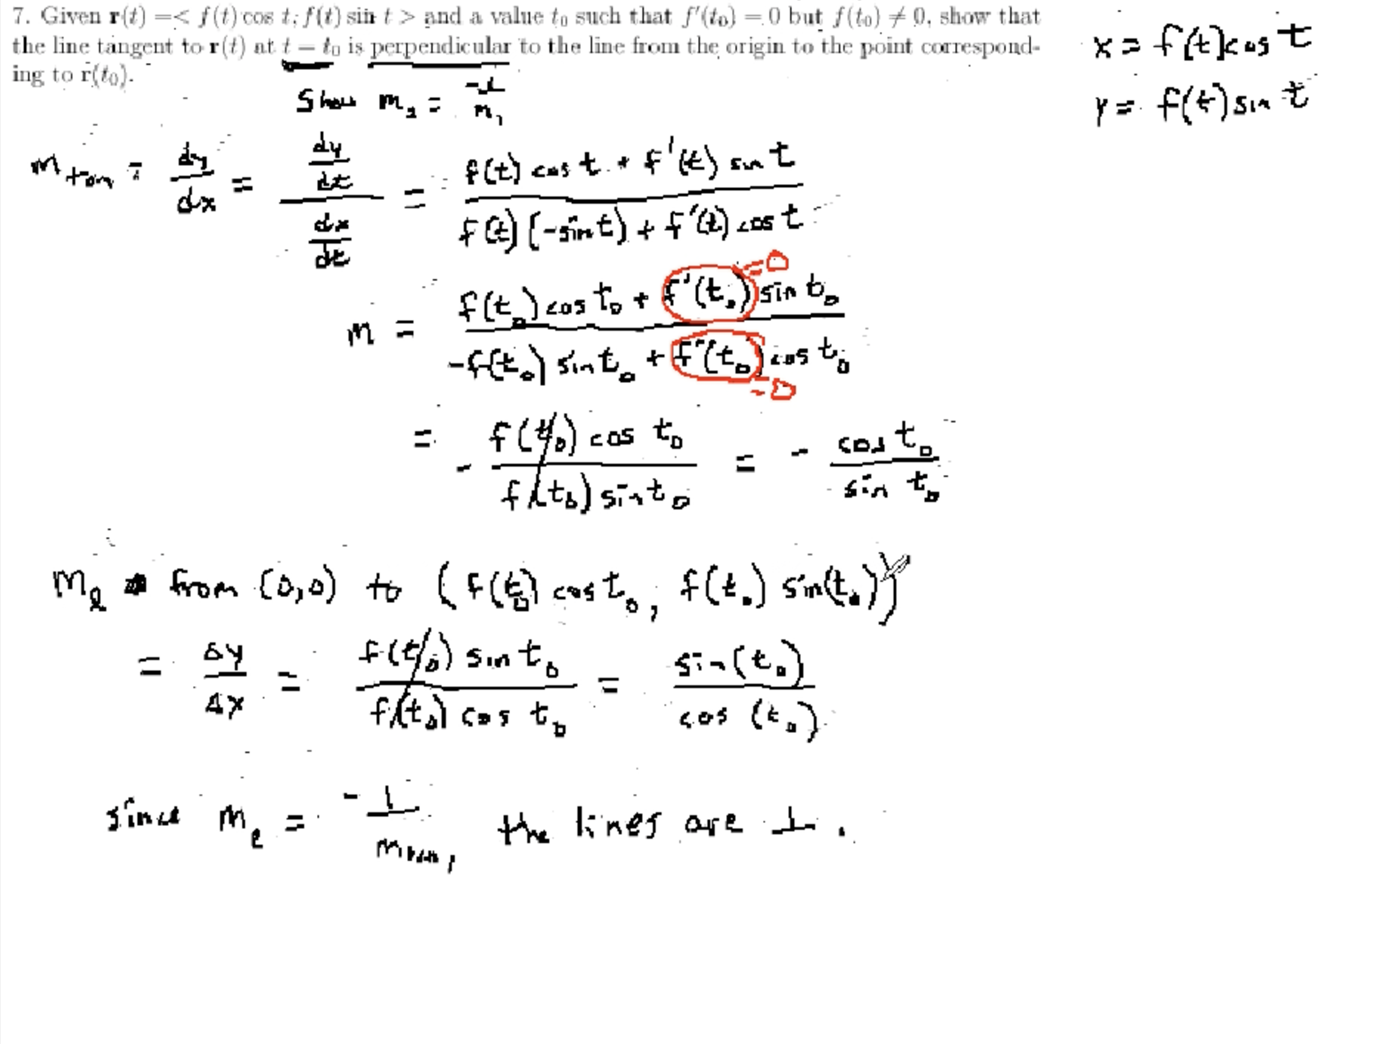
Proving facts about the derivatives of vector functions including the product rule
Properties of inverse trig functions and the derivative of arctangent
Properties and derivatives of inverse trigonometric functions
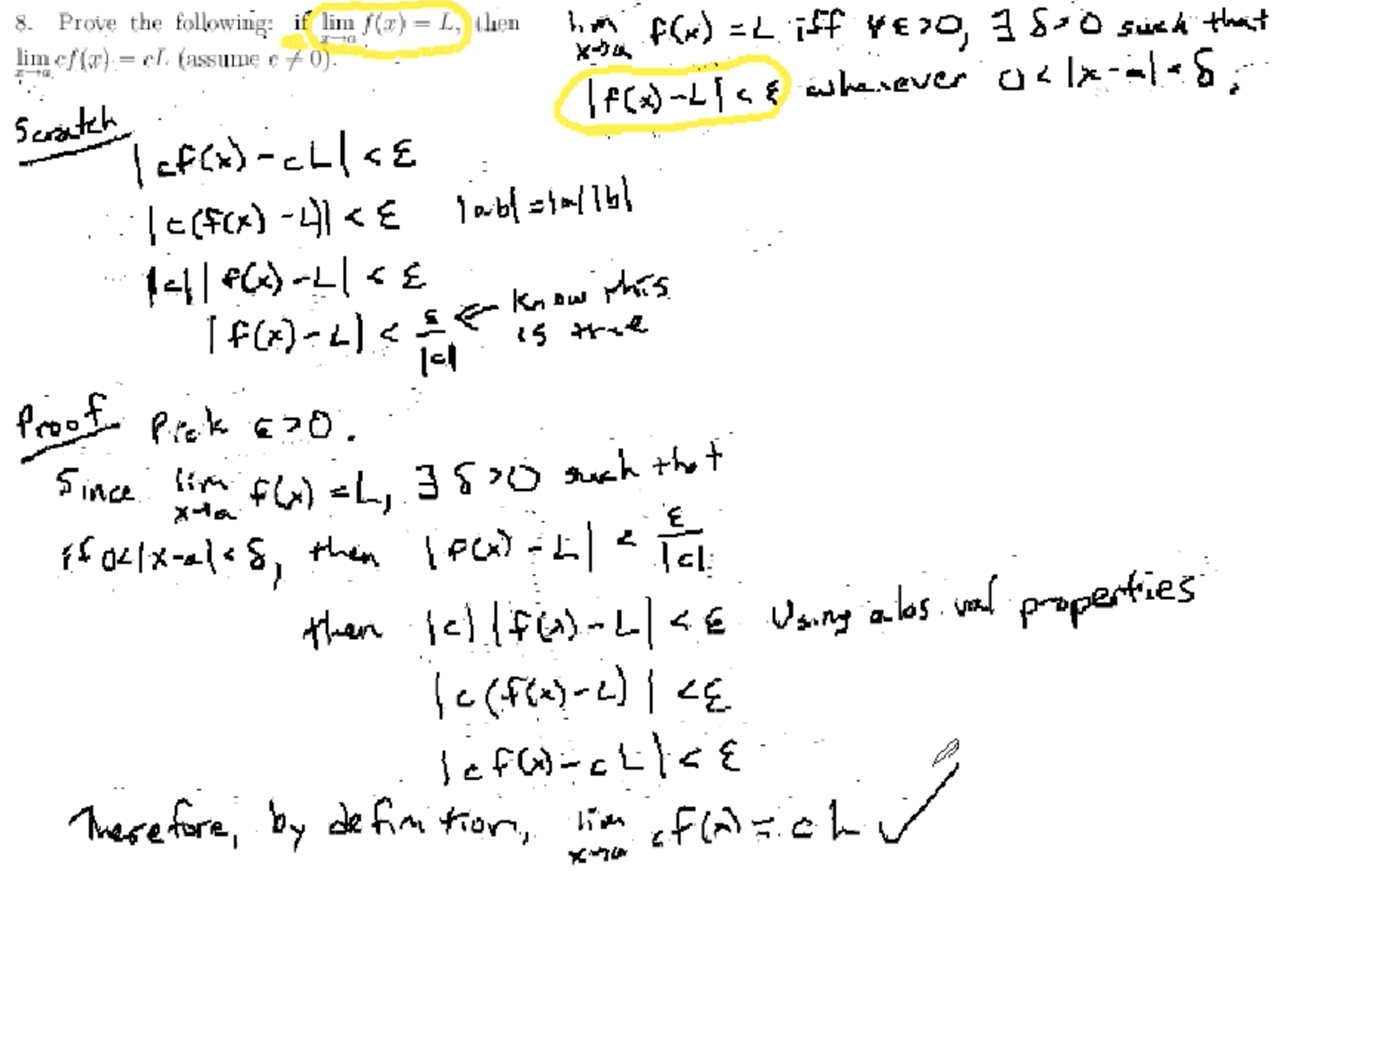
Proving a property of scalar multiplication for limits using the epsilon-delta definition and using the Squeeze Theorem for Limits.

Proving the derivatives of trigonometric functions and that sine is continuous
Properties and derivatives of inverse trigonometric functions
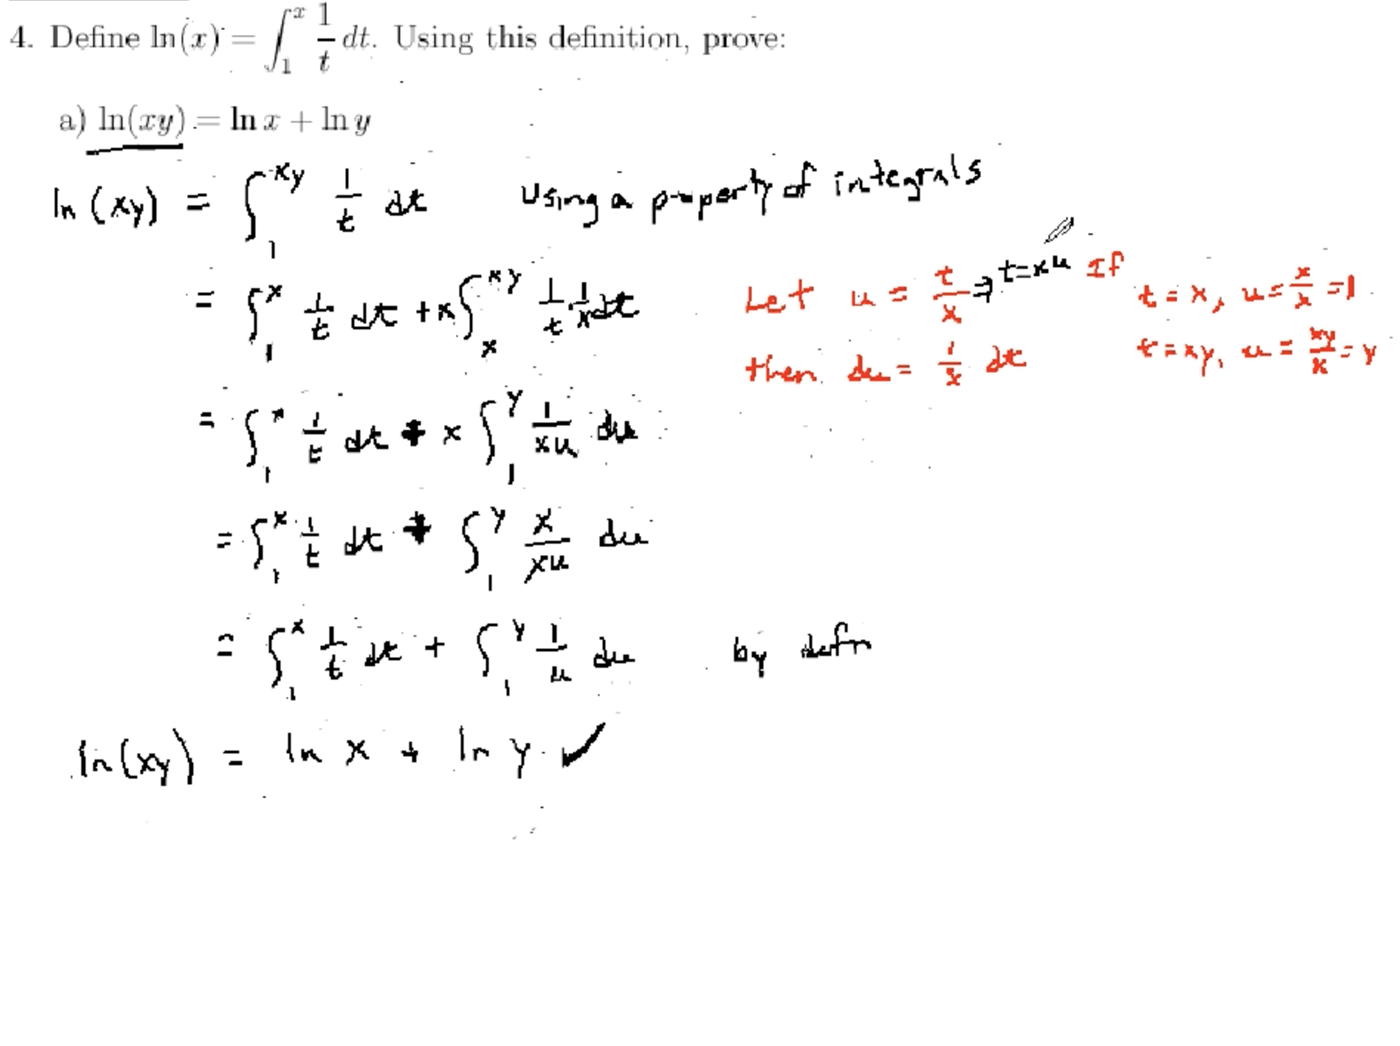
Using u substitution to evaluate integrals and prove facts about logarithms and integrals and

Interpreting integrals to represent areas between curves

Proving trigonometric identities useful for integration
Using trigonometric identities to integrate powers of sine and cosine
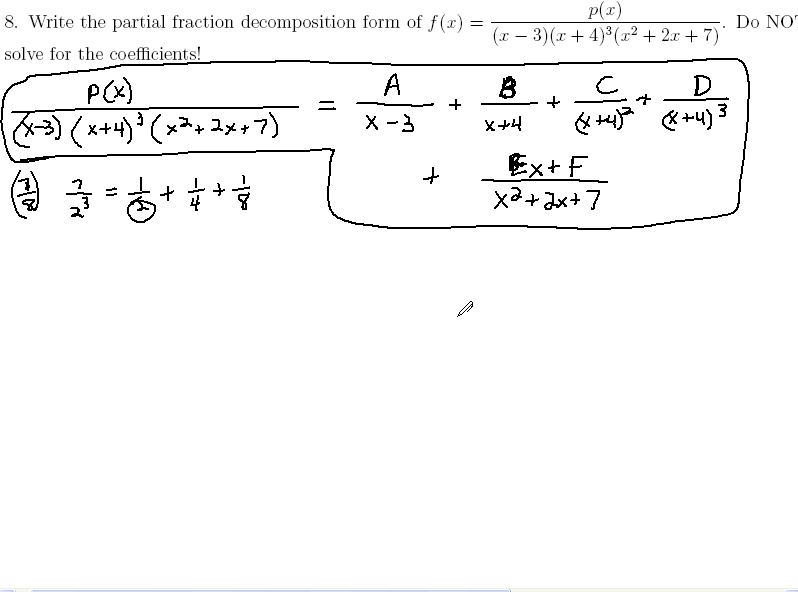
Finding a partial fraction decomposition and integrating using partial fractions

Using a rotation map matrix to rotate a 2-dimensional vector by the angle \(\pi\)

Finding the six trigonometric ratios for a right triangle

Using trig to find the length of the side of a right triangle given an angle and side length

Explaining the special right triangles and the relationships between their sides

Finding the exact value of tangent for several given angles using the unit circle

Finding the exact value of secant, cosecant, and cotangent using the unit circle

Finding the exact values of sine and secant for several given angles using the unit circle

Finding the angles where sine has a given value using the unit circle

Using the unit circle to sketch the graph of the sine function

Using the double angle identities for cosein to derive the half-angle identities for sine and cosine

Using the reciprocal and ratio trig identities to simplify an expression

Using the Pythagorean Identities to simplify a trig expression

Using the Pythagorean Trig Identity to derive the secondary Pythagorean Identities

Using the Sum Identity for Trig to find the exact value of sine

Using the Reciprocal, Ratio, and Pythagorean Identities to verify a trig identity

Proving a trigonometric identity involving secant, cotangent, and tangent

Proving a trig identity involving sine and cosine

Proving a trig identity involving sine, cosine, and cotangent

Finding all solutions to a trigonometric equation with sine

Solving a trigonometric equation with secant by factoring

Solving a trigonometric equation with tangent and sine by factoring

Using the Even/Odd and Cofunction Identities to solve an equation with sine

Solving a trig equation with cotangent and sine using trig identities

Solving a trig equation with cotangent and cosecant using trig identities

Solving a trig equation with sine and tangent using a trig identity

Using trigonometry to determine the edge lengths of a right triangle

Evaluating trigonometric functions given a point on the terminal side of an angle

Evaluating trigonometric functions given a point on the terminal side of an angle

Evaluating all six trigonometric functions for angles in degrees and radians

Evaluating all six trigonometric functions for a right triangle

Evaluating all six trigonometric functions for a right triangle

Finding the values of all six trigonometric functions of an angle given a right triangle

Evaluating the other five trigonometric functions for an acute angle given the value of sine

Evaluating the other five trigonometric functions given sine and that tangent is negative

Solving a trigonometric equation with sine and cosine on a given interval

Solving an equation with cosine on a given interval

Writing an equivalent algebraic expression for compositions with inverse trigonometric functions containing variables

Using inverse trigonometry to write an expression for an angle in a right triangle

Solving a trigonometric equation

Solving a trigonometric equation

Solving a trigonometric equation

Using a double angle formula to solve a trigonometric equation

Using a sum formula to evaluate a trigonometric expression

Using a difference formula to evaluate a trigonometric function

Using the Law of Sines to solve a triangle

Using the Law of Sines to solve a triangle

Using the Law of Sines to solve a triangle

Finding a vector given its length and angle with the positive x-axis

Finding the angle between two vectors

Cartesian equations and parametric equations of curves
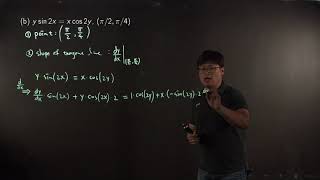
Tangent lines to parametric equations and related rates examples
Review of vector functions and parametric equations
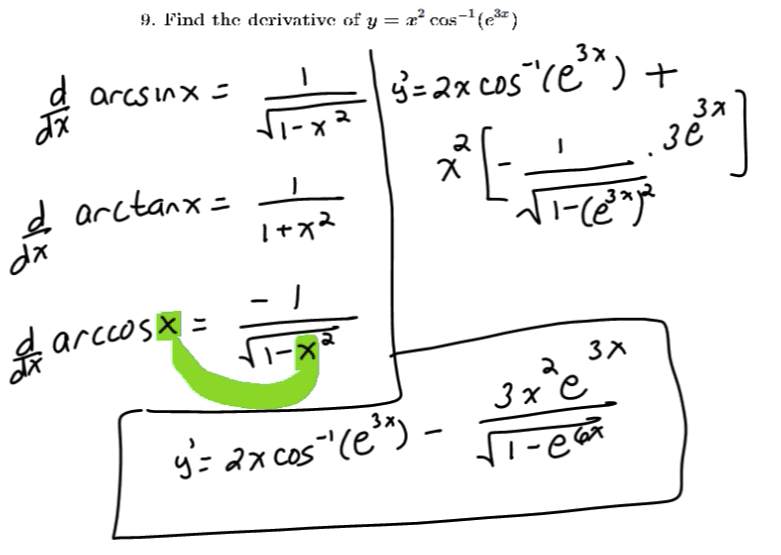
Review of limits and derivatives of inverse trigonometric functions
Implicit differentiation and physics applications of derivatives
Derivatives of parametric equations and tangent lines
Derivatives of exponential functions and the exponential model
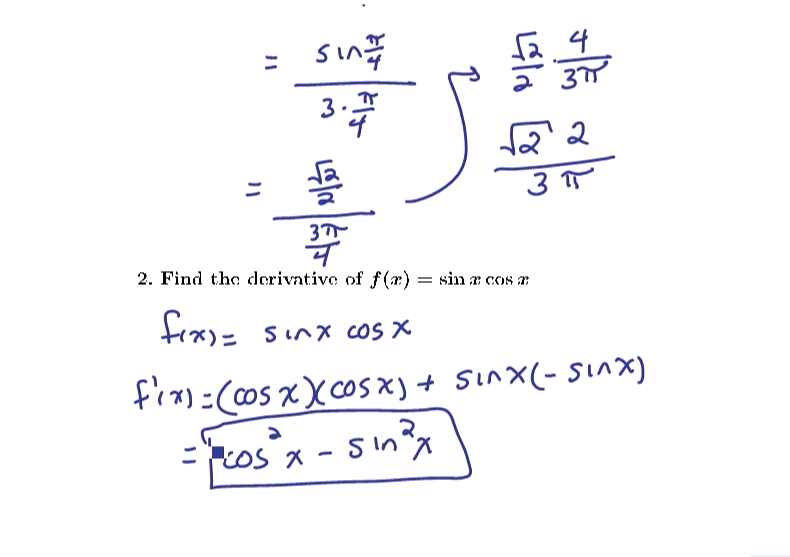
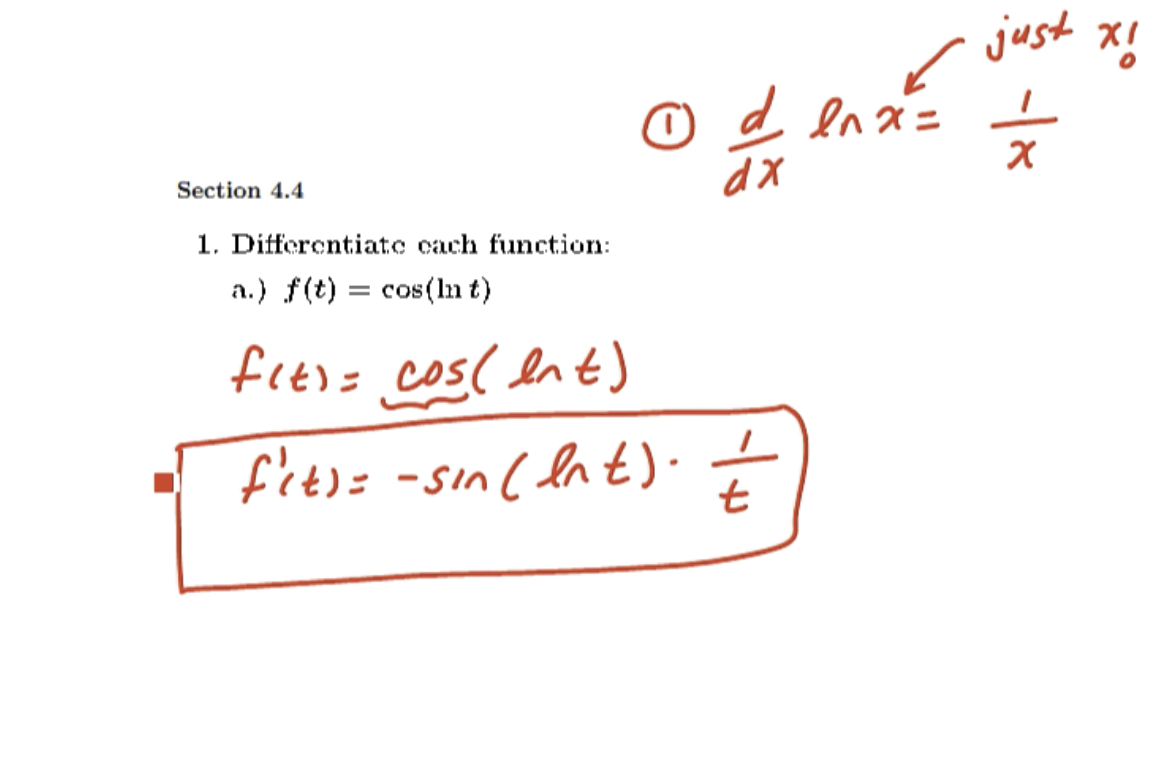
Reviewing the chain rule and the derivatives and limits of trigonometric functions
Review of limits and derivatives of inverse trigonometric functions
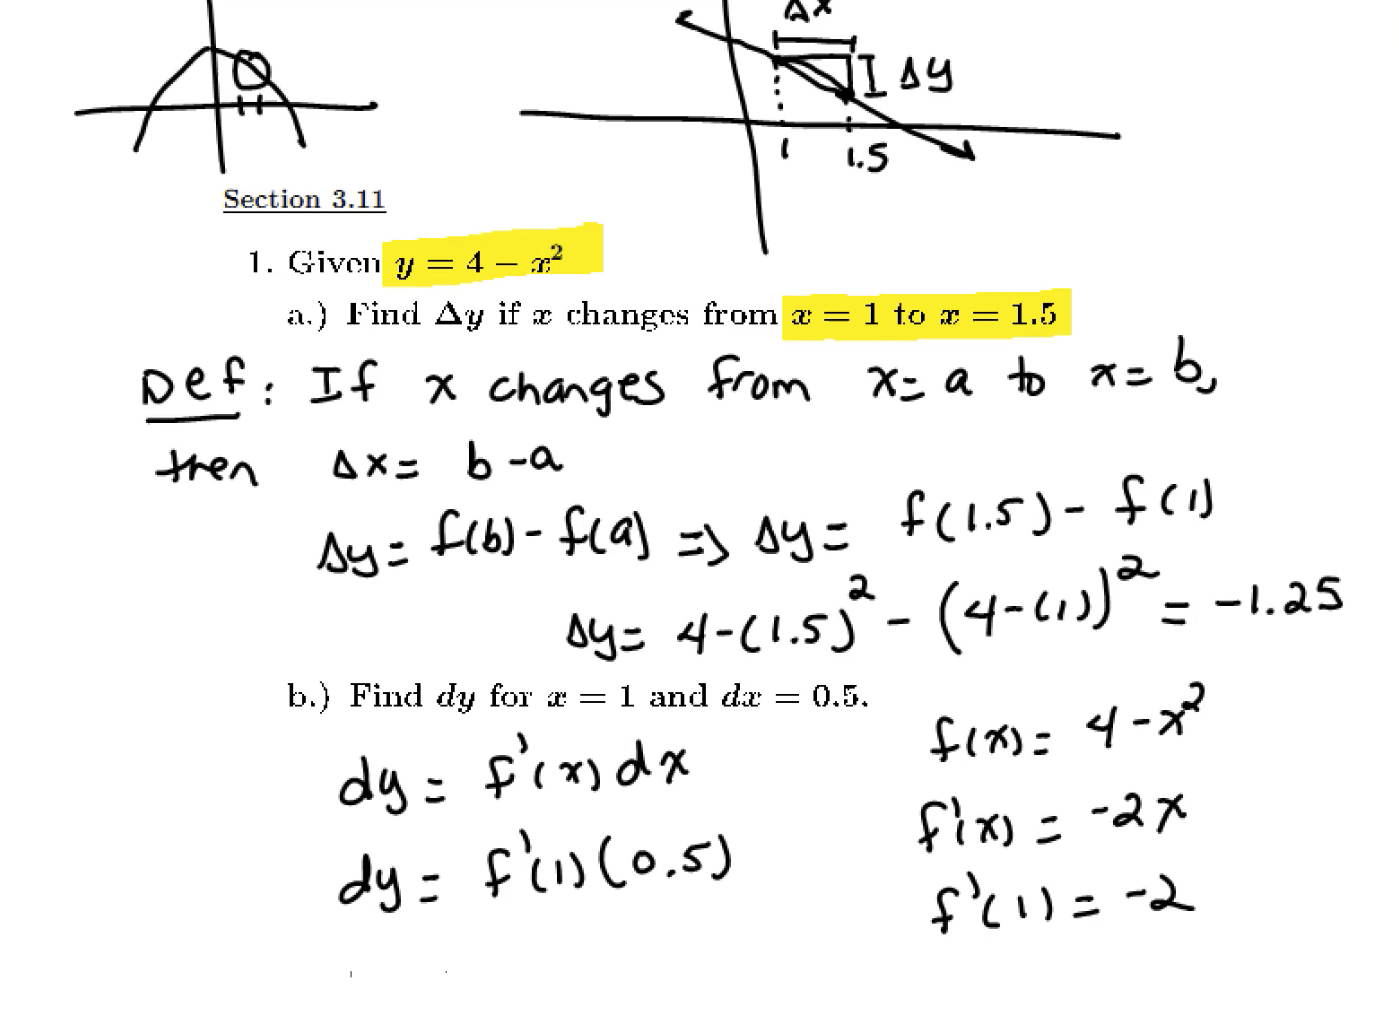
Differentials, linear approximations and quadratic approximations

Derivatives of trigonometric functions and using the Chain Rule

Derivatives of trigonometric functions and using the Chain Rule

Implicit differentiation and finding tangent lines
Derivatives of exponential and logarithmic functions and the exponential model

Derivatives of exponential and logarithmic functions and the exponential model

Tangent lines to parametric equations and related rates examples
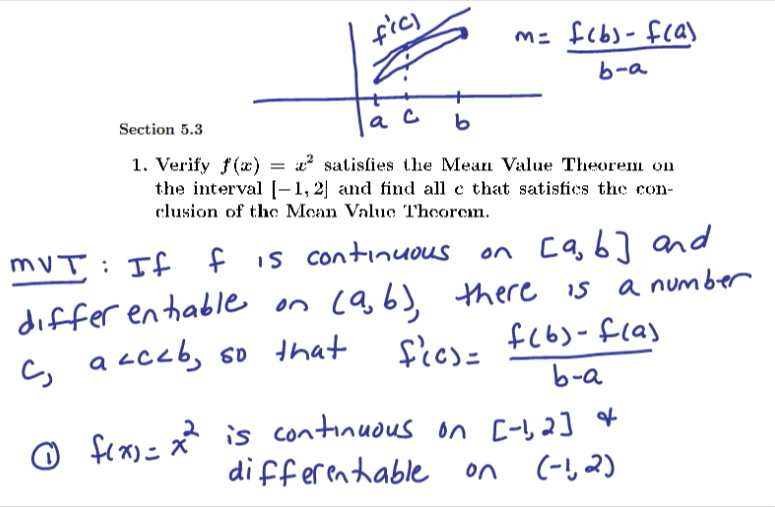
Mean Value Theorem and properties of a graph
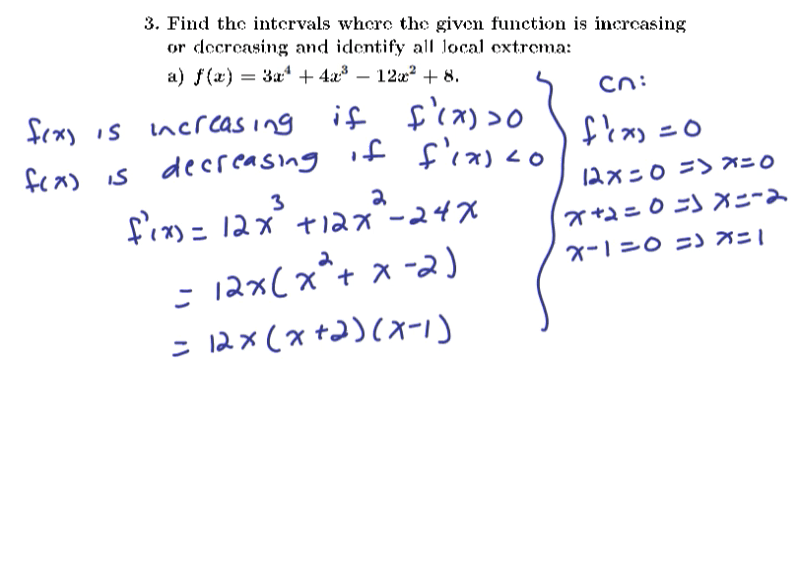
Mean Value Theorem and properties of a graph
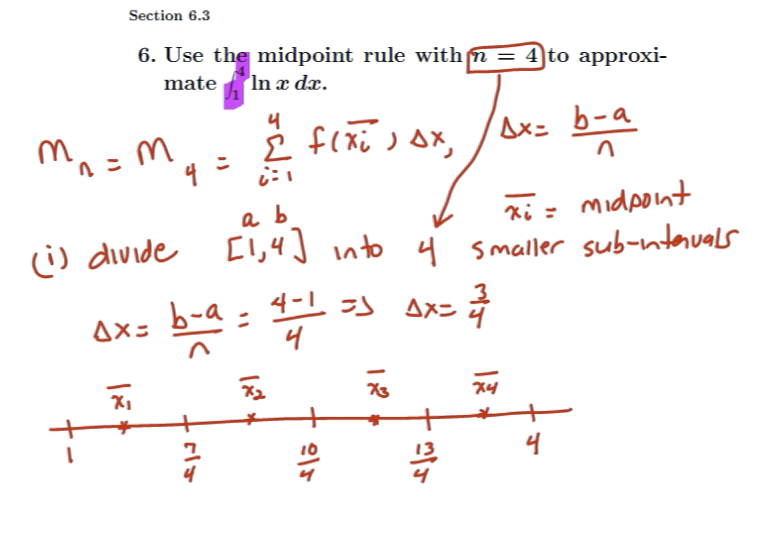
Using Reimann sums and the Fundamental Theorem of Calculus
Using Riemann sums and the Fundamental Theorem of Calculus
Examples of integration by substitution

Evaluating a composition of trigonometric and inverse trigonometric functions

Simplifying expressions containing trigonometric and inverse trigonometric functions

Calculating the work done pushing a crate up a ramp

Find the measure of an angle given the three vertices for the angle

Using the Chain Rule to differentiate functions

Using the Chain Rule to differentiate functions with exponential and trigonometric functions

Using the Chain Rule to differentiate a function containing trigonometric functions

Using the Chain Rule to find the pattern for a higher order derivative

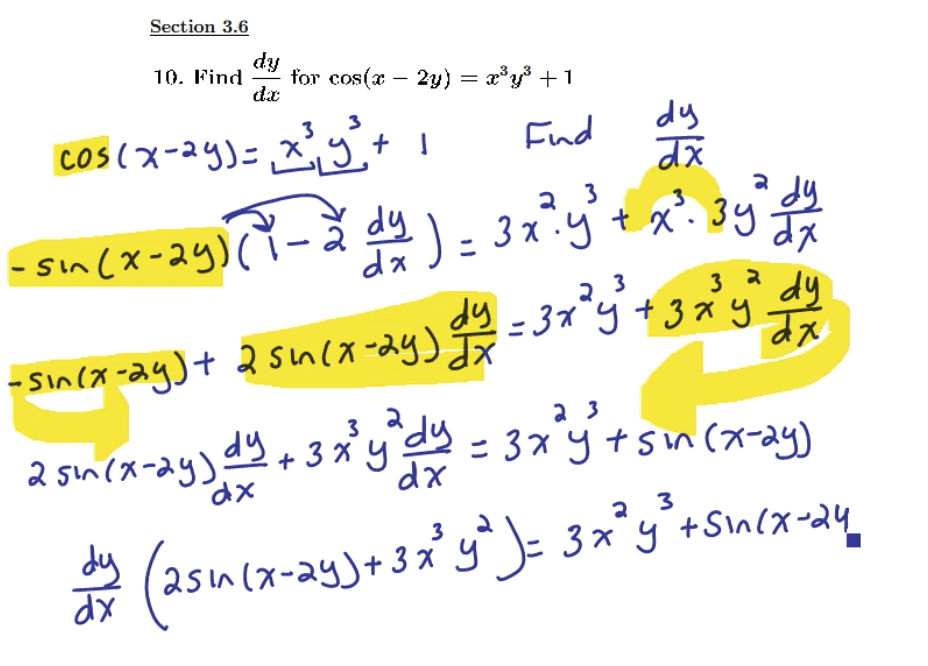
Finding the derivative using implicit differentiation

Finding the derivative using implicit differentiation

Finding the derivative using implicit differentiation

Finding the derivative using implicit differentiation
Finding a tangent line to an curve defined implicitly

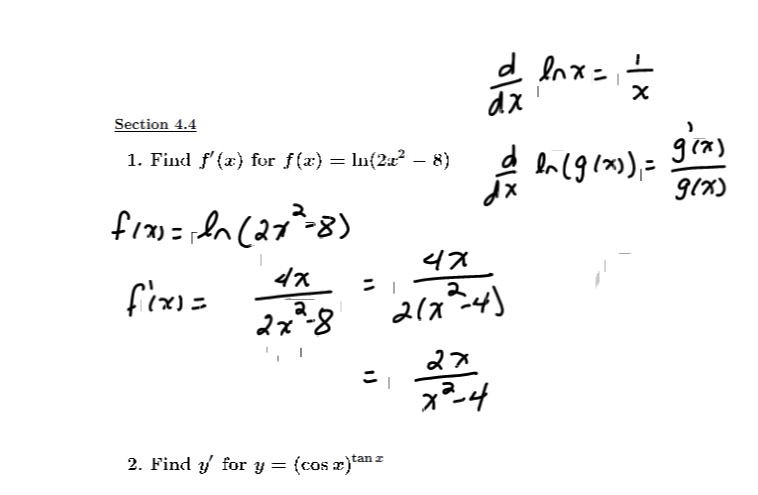
Finding the derivative of a function containing a logarithmic function

Finding the derivatives of functions containing logarithms

Finding the derivative of a function containing a logarithms

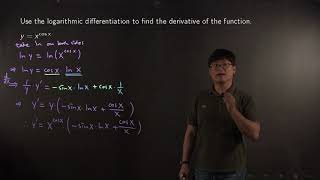
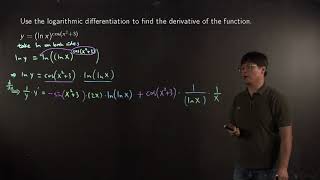
Using logarithmic differentiation to find the derivative of a function

Using logarithmic differentiation to find the derivative of a function

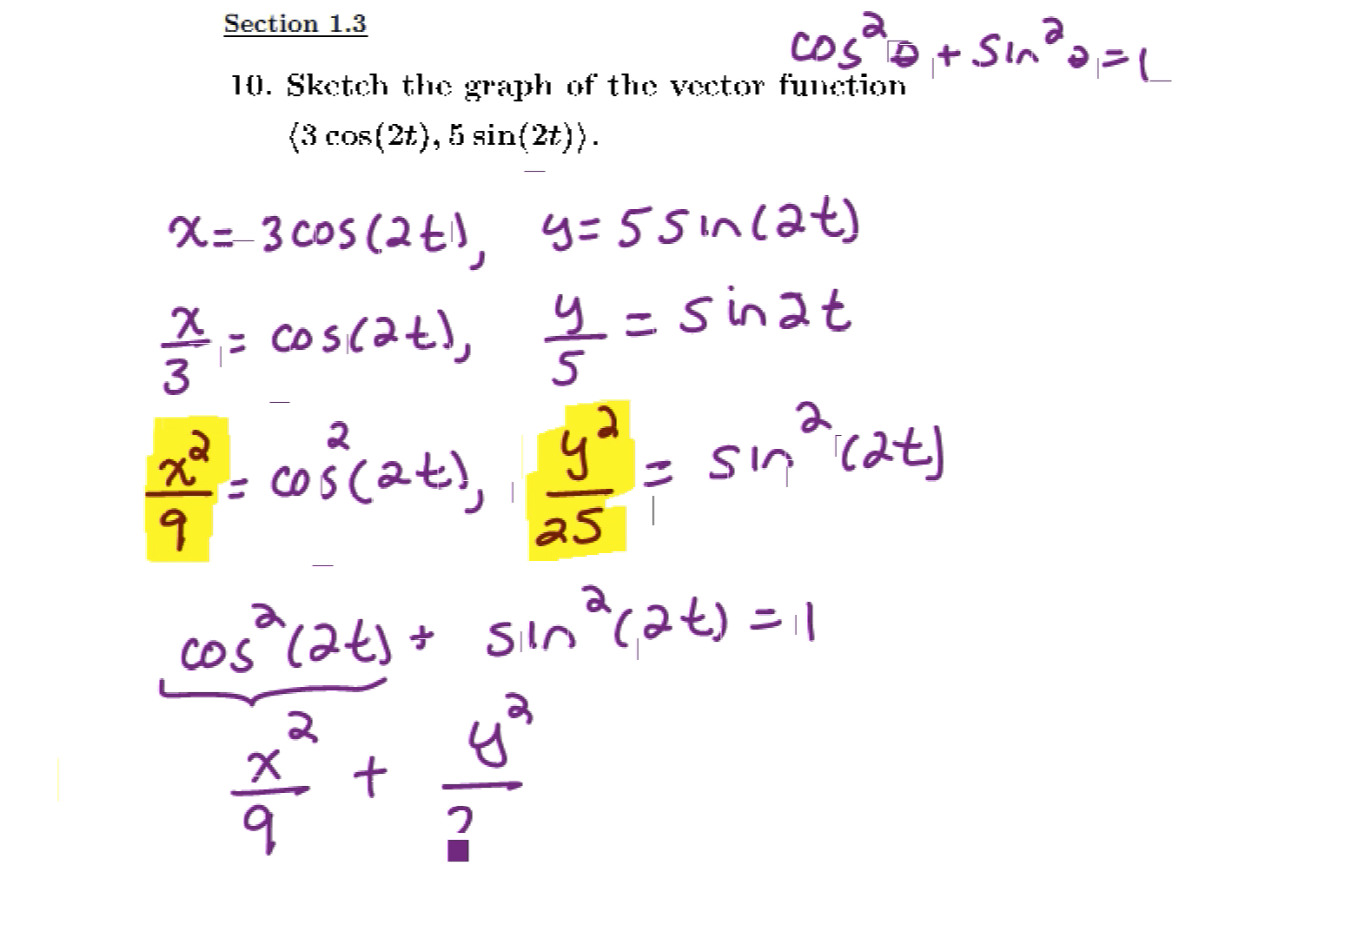
Graphing a vector function by converting it to a Cartesian equation
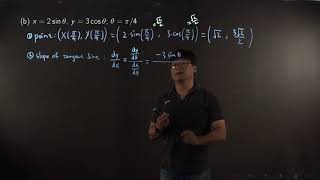
Finding the tangent line to a parametric curve

Using the Product and Chain Rule to find several derivatives

Using the Quotient and Chain Rules to find several derivatives

Using the Product and Chain Rules to differentiate functions with logarithms

Differentiating functions with logarithmic and inverse trigonometric functions

Using the chain rule to find a derivative
Using logarithmic differentiation to find the derivative of a function
Using logarithmic differentiation to find the derivative of a function

Finding where a function has horizontal tangent lines

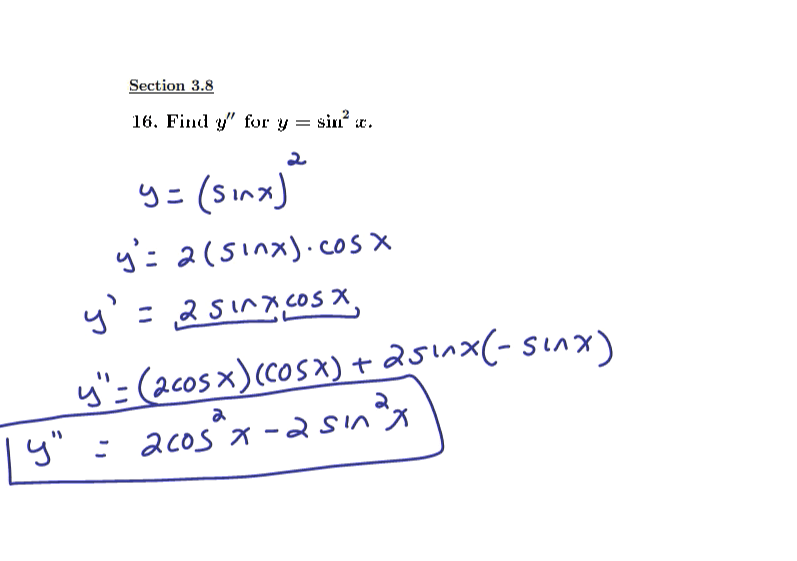
Finding a higher order derivative of a function

Finding the absolute maximum and absolute minimum values of a function on a closed interval

Evaluating a limit using L'Hospital's Rule

Finding the antiderivative of a function

Finding a function from its second derivative using antidifferentiation

Antidifferentiating twice to find a function from its second derivative

Antidifferentiating twice to find a function from its second derivative

Antidifferentiating to find a function from its derivative

Antidifferentiating twice to find a function from its second derivative

Evaluating a limit with an indeterminant product using L'Hospital's Rule

Finding the antiderivative of a function and using a function value to find the constant

Calculating a composition of tangent and arcsine

Finding a derivative using the Chain Rule multiple times

Finding the derivative of an implicit function

Finding the derivative of an implicit function

Determining the rate that the area of a triangle is increasing based on the rate an angle is increasing

Using L'Hospital's Rule to solve a limit

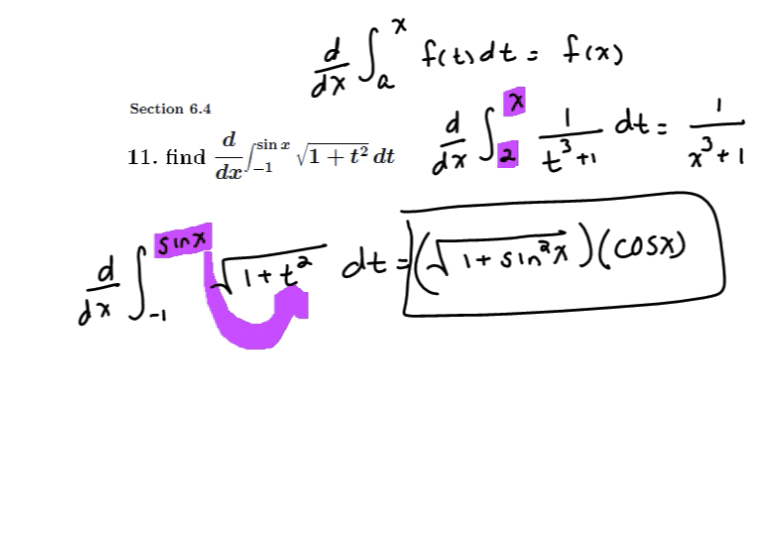
Using the Fundamental Theorem of Calculus to find the derivative of a function defined using an integral

Evaluating a definite integral with an exponential and sine function

Using u-substitution to evaluate an indefinite integral
Review of sequences and finding the sum of a series

Review of trigonometric substitution

Review of Taylor and Maclaurin Series and their properties

Converting parametric equations into a Cartesian equation and graphing

Find the integral representing the surface area of a rotated parametric curve

Finding the area of a region defined using polar coordinates

Finding Taylor and Maclaurin Series for functions

Finding the Maclaurin series of a function

Determining if a series is absolutely convergent, conditionally convergent, or divergent.

Solving an indefinite integral with cosine using integration by parts

Evaluating an integral using integration by parts

Evaluating an integral using trigonometric identities

Evaluating an integral using trigonometric identities

Using trigonometric identities to integrate powers of secant and tangent

Using trigonometric identities to solve an integral with powers of sine and cosine

Using trigonometric identities to integrate a power of cosine

Using a trigonometric identity to integrate powers of sine and cosine

Using a trigonometric identity to integrate powers of sine and cosine

Using trigonometric identities to integrate even powers of sine and cosine

Using a trigonometric identity to integrate an even power of cosine

Using trigonometric identities to integrate powers of cosine and tangent

Using u-substitution on an indefinite integral with an exponential function, sine, and cosine

Proofs of the Cauchy-Schwarz Inequality and a property of vector projections
Cartesian equations and parametric equations of curves
Tangent lines to parametric equations and related rates examples
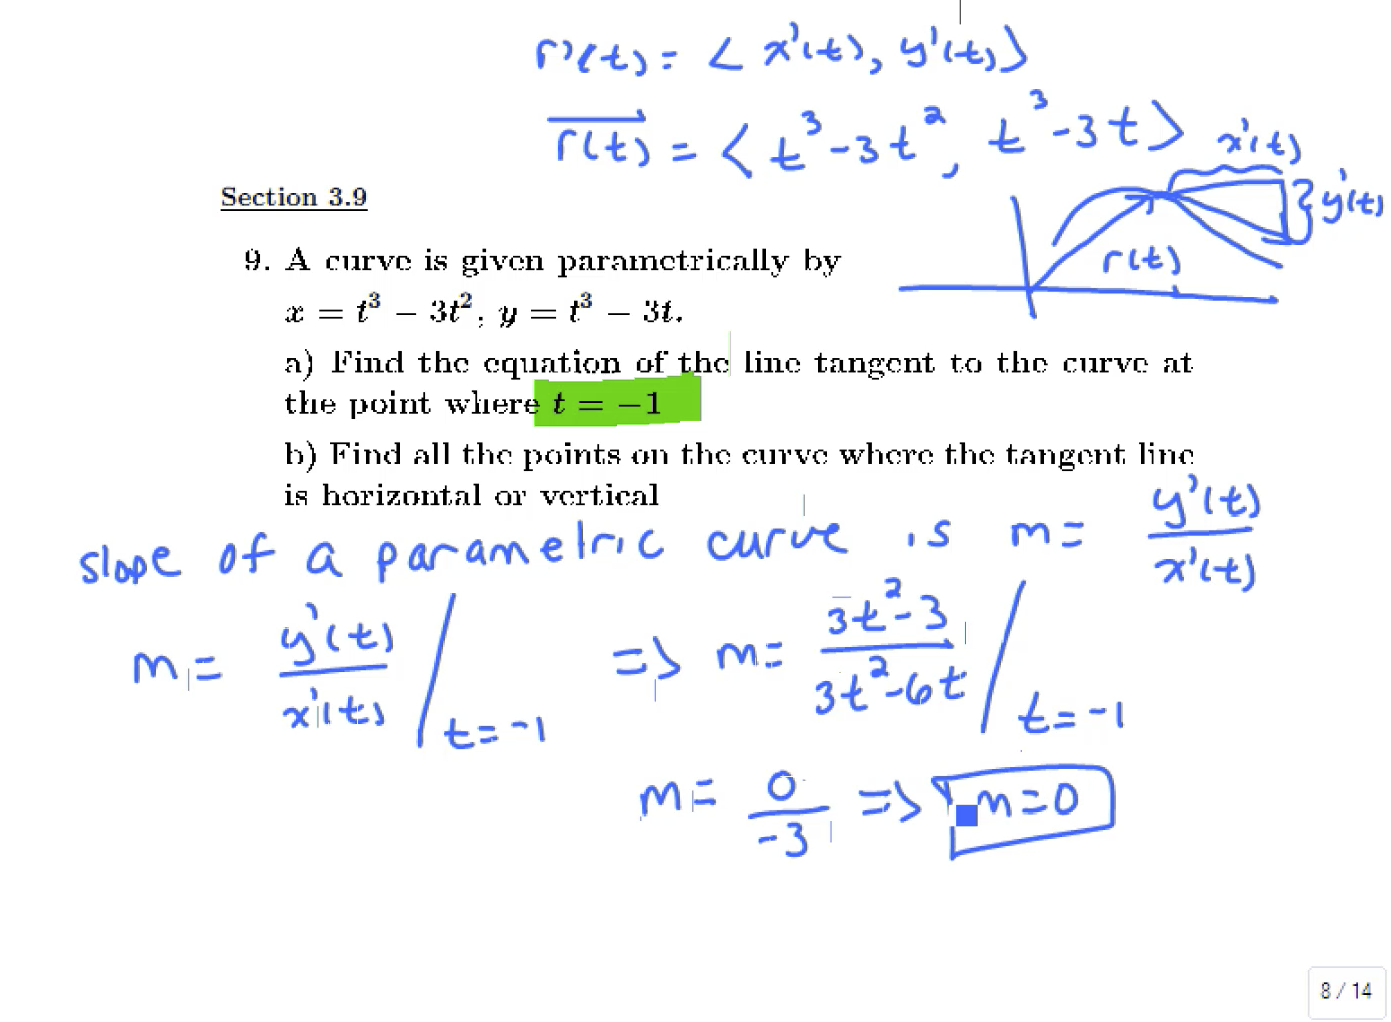
Calculating slopes of tangent lines to parametric curves
Implicit differentiation and physics applications of derivatives
Derivatives of parametric equations and tangent lines
Derivatives of exponential functions and the exponential model
Reviewing the chain rule and the derivatives and limits of trigonometric functions
Review of limits and derivatives of inverse trigonometric functions
Differentials, linear approximations and quadratic approximations
Derivatives of trigonometric functions and using the Chain Rule
Derivatives of trigonometric functions and using the Chain Rule
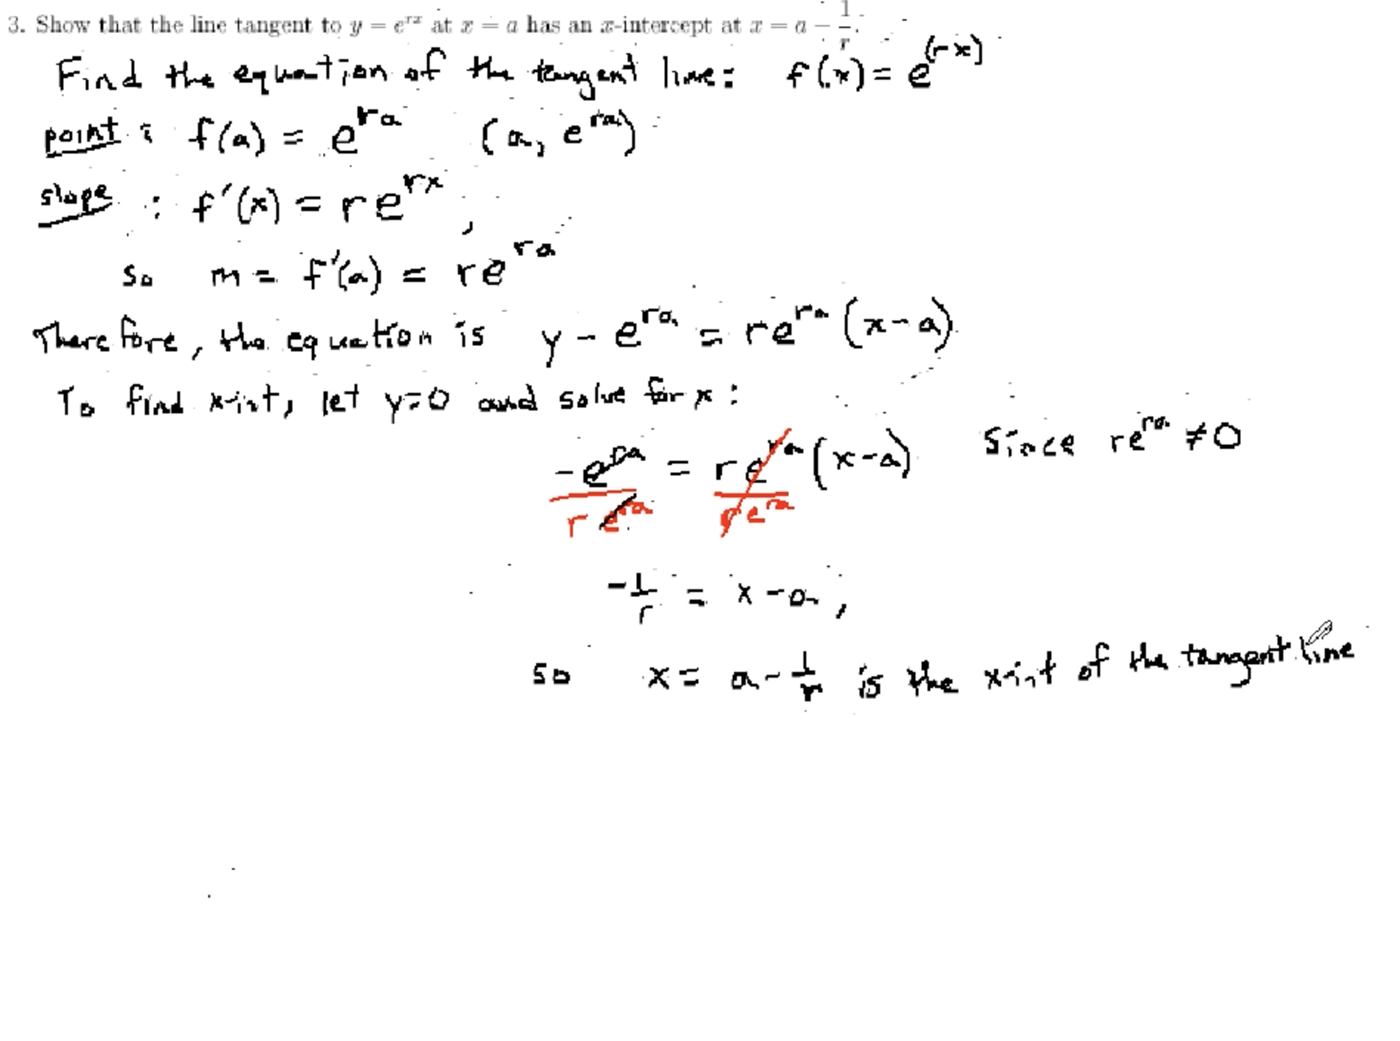
Examples involving the tangent line to an exponential function and finding the derivative of hyperbolic cosine
Implicit differentiation and finding tangent lines
Derivatives of exponential and logarithmic functions and the exponential model
Tangent lines to parametric equations and related rates examples
Mean Value Theorem and properties of a graph
Mean Value Theorem and properties of a graph
Using Reimann sums and the Fundamental Theorem of Calculus
Using Riemann sums and the Fundamental Theorem of Calculus
Examples of integration by substitution
Review of sequences and finding the sum of a series
Review of trigonometric substitution
Review of Taylor and Maclaurin Series and their properties
Finding Taylor and Maclaurin Series for functions

Reviewing Taylor and Maclaurin Series and Taylor's Inequality
Using trigonometric identities to integrate powers of secant and tangent

Integrating using a trigonometric substitution

Finding the angle of intersection for two three-dimensional vector functions

Finding the length of a three-dimensional curve

Finding the position vector function given the velocity and an initial position

Finding all second-order partial derivatives of a function of two variables

Finding the maximum rate of change and the direction it occurs for a function of two variables

Evaluating a double integral over a rectangle

Evaluating a double integral by changing to polar coordinates

Evaluating a double integral by changing to polar coordinates

Converting a double integral to a double integral in polar coordinates

Using an iterated integral in spherical coordinates to find the volume of a solid

Evaluating a triple integral for a given solid by writing an iterated integral in spherical coordinates

Evaluating a line integral along half a circle

Evaluating a line integral of a vector field along an curve

Using Green's Theorem to evaluate a line integral on a closed curve

Evaluating a surface integral over a cylinder

Explaining the Pythagorean Theorem and using it to find a missing side in a right triangle

Special Right Triangles Exercise 1

Special Right Triangles Exercise 2

Discussing the degree and radian measure of special angles on the unit circle

The coordinates for the quadrantal angles on the unit circle

Finding the coordinates on the unit circle for the common angles in the first quadrant

Finding the coordinates on the unit circle for all the common angles

Defining radians for angle measure using the corresponding arc length on a unit circle

Converting an angle measured in degrees to radians

Converting angles measured in radians to degrees

How to find reference angles for angles in standard position

Defining coterminal angles and how to determine if angles are coterminal

Drawing an angle in standard position

Finding a negative and positive coterminal angle for a given angle

Drawing an angle in standard position and finding its reference angle

Drawing an angle in standard position and finding its reference angle

Finding a coterminal angle along with its reference angle and graphing it

Finding a coterminal angle along with its reference angle and graphing it

Finding the values of \(\theta\) that makes a matrix with trig functions invertible

Determining whether trigonometric functions are linearly independent

Finding the dimension of the subspace spanned by a set of functions

Using trigonometry to determine the height of a tree

Finding trigonometric functions given information about the angle

Evaluating a composition of tangent and arccosine

Finding the solutions to an equation with tangent in a given interval

Solving a trigonometric equation with sine on a given interval

Solving an quadratic-like equation with sine by factoring

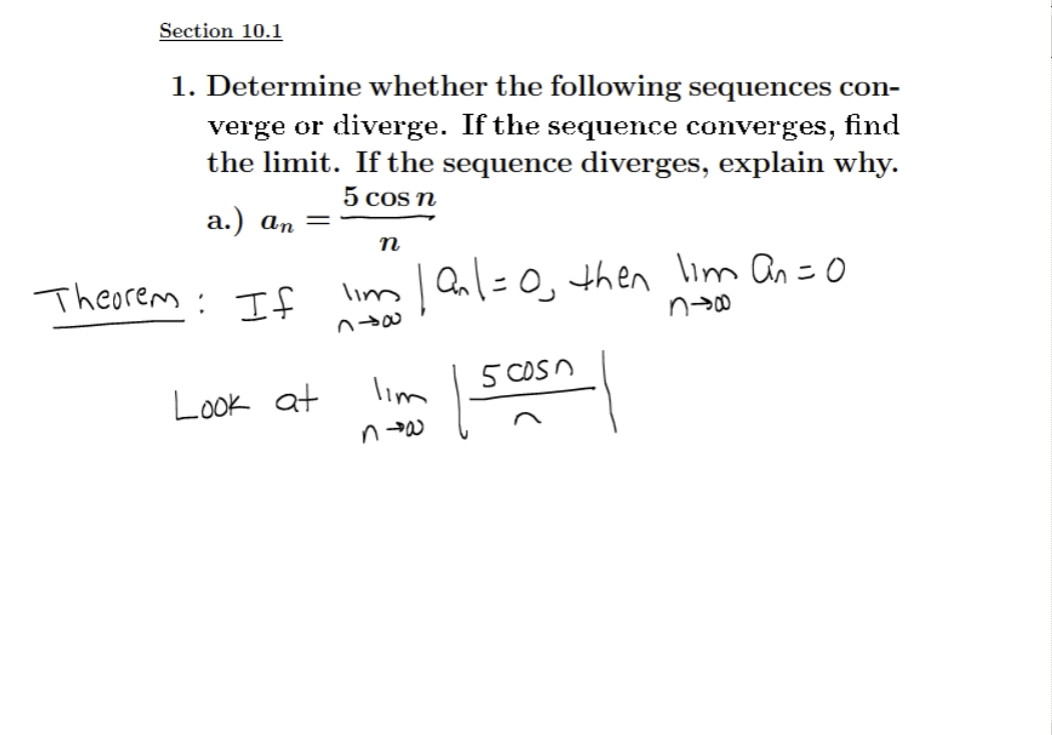
Determining if a series converges or diverges

Using the comparison test to determine if a series converges or diverges

Using the comparison test to determine if a series converges or diverges

Using the Alternating Series Test to determine if a series converges or diverges

Solving equations symbolically in Python and interpreting the results
Review of vector functions and parametric equations
Review of limits and derivatives of inverse trigonometric functions